Constructed Response Practice Exam
advertisement
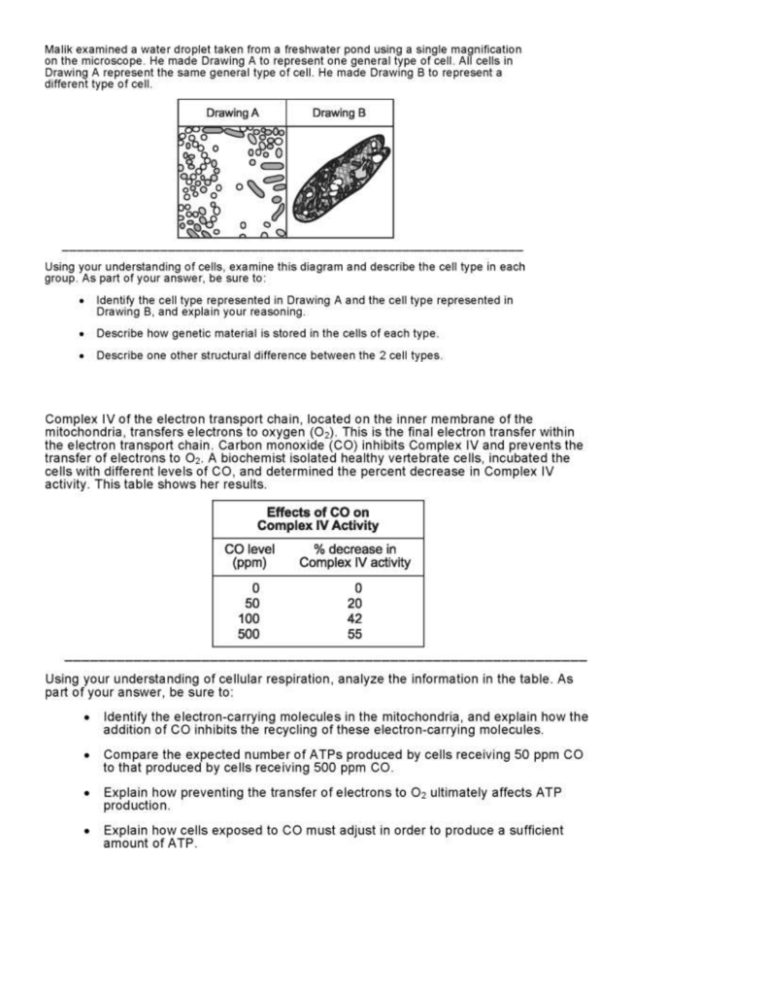
A 4-point response will include, but is not limited to, the following points: Identification of cell type in each drawing: Drawing A cells are prokaryotic cells (prokaryotes). The Drawing B cell is a eukaryotic cell (eukaryote). Explanation of reasoning: Drawing A cells are prokaryotic because they are very small and simple compared to the cells in Drawing B. No internal cellular structures are visible. The Drawing B cell is eukaryotic because it is much larger and more complex compared to the cells in Drawing A. Internal cellular structures are visible. Description of how the genetic material is stored in each cell type: Prokaryotic cells do not have a membrane-bound nucleus. The genetic material exists as a coiled loop of DNA. Eukaryotic cells have a membrane-bound nucleus. The genetic material exists as chromosomes within the nucleus. The chromosomes are composed of DNA wrapped around proteins. Description of another structural difference between the 2 cell types: Prokaryotic cells do not contain any membrane-bound organelles; however, eukaryotic cells contain numerous types of membrane-bound organelles. Note: Some students may include that, in general, prokaryotic cells have cell walls. Some eukaryotes have cell walls; however, the chemical makeup of the cell wall is different in each eukaryotic kingdom. A 4-point response will include, but is not limited to, the following points: Identification of electron-carrying molecules in the mitochondria: NADH and FADH2 Explanation of how CO inhibits the recycling of electron-carrying molecules: NADH and FADH2 donate electrons to the early steps of the electron transport chain and are converted to NAD+ and FAD in the process. The electron transport chain transfers these electrons along the chain, ultimately transferring the electrons to O 2 at the end of the chain. The addition of CO prevents this transfer of electrons to O2. This slows down the electron transport chain, resulting in a build-up of NADH and FADH2 molecules within the mitochondria. Comparison of the expected number of ATPs produced by cells exposed to 50 ppm CO to that produced by cells exposed to 500 ppm CO: Cells receiving 50 ppm CO should produce approximately 29–30 ATP molecules per glucose molecule (80% of 36 or 38). Cells receiving 500 ppm CO should produce approximately 16– 17 ATP molecules per glucose molecule (45% of 36 or 38). Note: The number of ATPs produced for this response will depend upon whether the teacher and/or text book states the number of ATPs produced per glucose molecule is 36 or 38. Explanation of how preventing the transfer of electrons to O2 affects ATP production: The transfer of electrons down the electron transport chain forces hydrogen ions to increase in concentration on one side of the inner membrane of the mitochondria (specifically in the intermembrane space). These hydrogen ions then move down their concentration gradient across the membrane through ATP synthase, which results in the production of ATP. Since CO prevents the transfer of electrons to O2, the movement of electrons along the electron transport chain is inhibited. This, in turn, inhibits the movement of hydrogen ions (H+) across the inner membrane of the mitochondria and the subsequent production of ATP. Explanation of how cells exposed to CO must adjust to produce sufficient amounts of ATP: There are 2 ways in which cells exposed to CO can adjust. (Only one description is necessary to answer the question.) 1) Cells exposed to CO may begin carrying out fermentation processes. This usually occurs when cells do not have adequate amounts of O2. The addition of CO would cause the same result as not having enough O2. OR 2) Cells exposed to CO may increase the rate of all cellular respiration processes (glycolysis, the Krebs cycle, and the electron transport chain). This could increase the quantity of NADH and FADH2 molecules adding electrons to the electron transport chain, and the amount of O 2 in the cell, thereby overcoming the inhibition on Complex IV activity. Student 1: Species A is the oldest species shown in the cladogram. This statement is incorrect. Many students fail to correctly interpret the flow of time on vertical cladograms. A student who agrees with Student 1’s statement is most likely reading the flow of time from left to right (oldest on the left, youngest on the right). In vertically oriented trees, time flows from bottom to top. A correct response will identify this statement as incorrect and explain the correct spatial relationship of the flow of evolutionary time. Correct statement: Species A Species D is more closely related to Species E than to Species A. Some students will associate relatedness with tip proximity or node count. A student who identifies this statement as true may be using either of these incorrect methods to determine relatedness. A correct response will identify the statement as incorrect and explain that Species A and Species D diverged from a common ancestor more recently in evolutionary time than Species D and E. Correct statement: Species D is more closely related to Species A than to Species E A, B, C, and D descended from Species E. Some students may think that a straight, unbranching line between two species indicates that no evolutionary change has occurred (Species E and Species F are the same). A correct answer will identify this statement as incorrect and explain that Species E is descended from the same common ancestor, but is not the same species as the common ancestor. Correct statement: Species A, B, C, D, and E all descended from a common ancestor (Species F A and Species B share a more recent common ancestor than Species A and Species C. This statement is correct. Species A and Species B are connected by a common node indicating that they branched off from a common ancestor (Species J) at a more recent point in evolutionary time than Species A and Species C branched off from their most recent common ancestor (Species H). Possible misconceptions: Many students misinterpret the flow of time on vertical cladograms, associate relatedness with tip proximity or node count, and/or misinterpret a straight, unbranching line to mean no change.
