Velocity-Time Graphs Worksheet: Physics Practice
advertisement
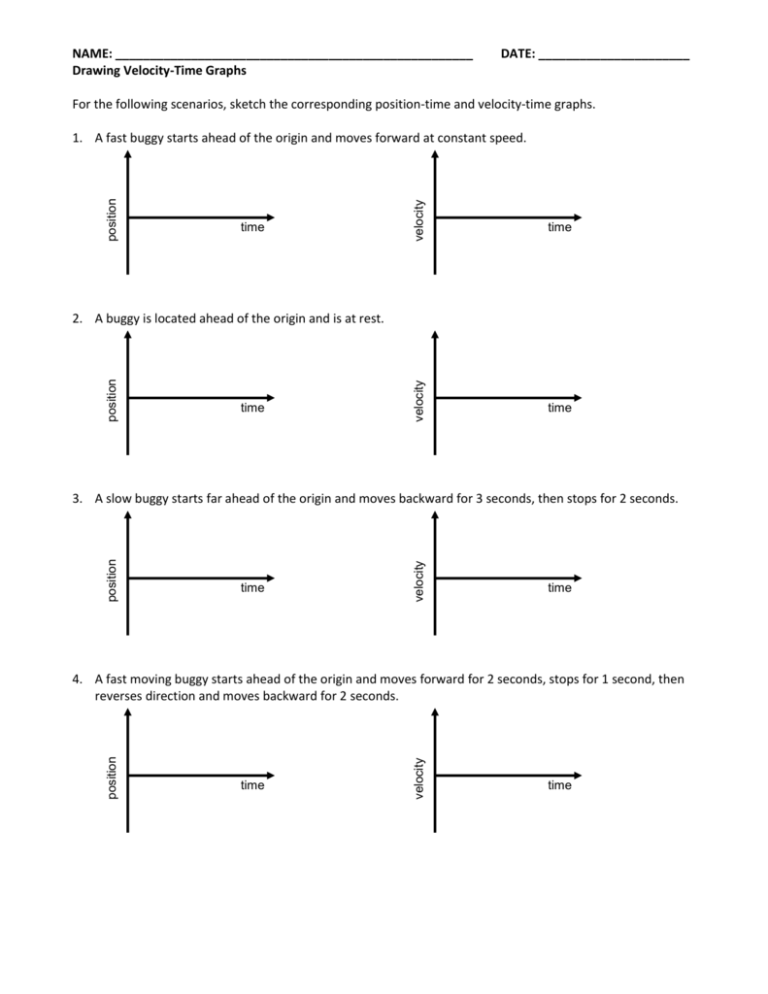
NAME: ____________________________________________________ Drawing Velocity-Time Graphs DATE: ______________________ For the following scenarios, sketch the corresponding position-time and velocity-time graphs. time velocity position 1. A fast buggy starts ahead of the origin and moves forward at constant speed. time time velocity position 2. A buggy is located ahead of the origin and is at rest. time time velocity position 3. A slow buggy starts far ahead of the origin and moves backward for 3 seconds, then stops for 2 seconds. time time velocity position 4. A fast moving buggy starts ahead of the origin and moves forward for 2 seconds, stops for 1 second, then reverses direction and moves backward for 2 seconds. time For each position-time graph, draw the corresponding velocity-time graph: 5. 4 3 velocity (m/s) position (m) 2 2 1 1 0 0 1 2 3 4 0 1 2 3 4 time (s) -1 0 0 6. 1 2 3 time (s) 4 -2 4 3 velocity (m/s) position (m) 2 2 1 1 0 time (s) -1 0 0 1 2 3 time (s) 4 -2 4 2 3 velocity (m/s) position (m) 7. 2 1 0 0 1 2 3 time (s) 4 5 1 0 0 1 2 3 4 5 time (s) -1 -2 For the three scenarios above… 8. Rank them from smallest distance traveled to largest distance traveled: ____________________________ 9. Rank them from most negative displacement to most positive displacement: ________________________ 10. Rank them from most negative average velocity to most positive average velocity: ____________________
