motion diagram-average velocity12
advertisement
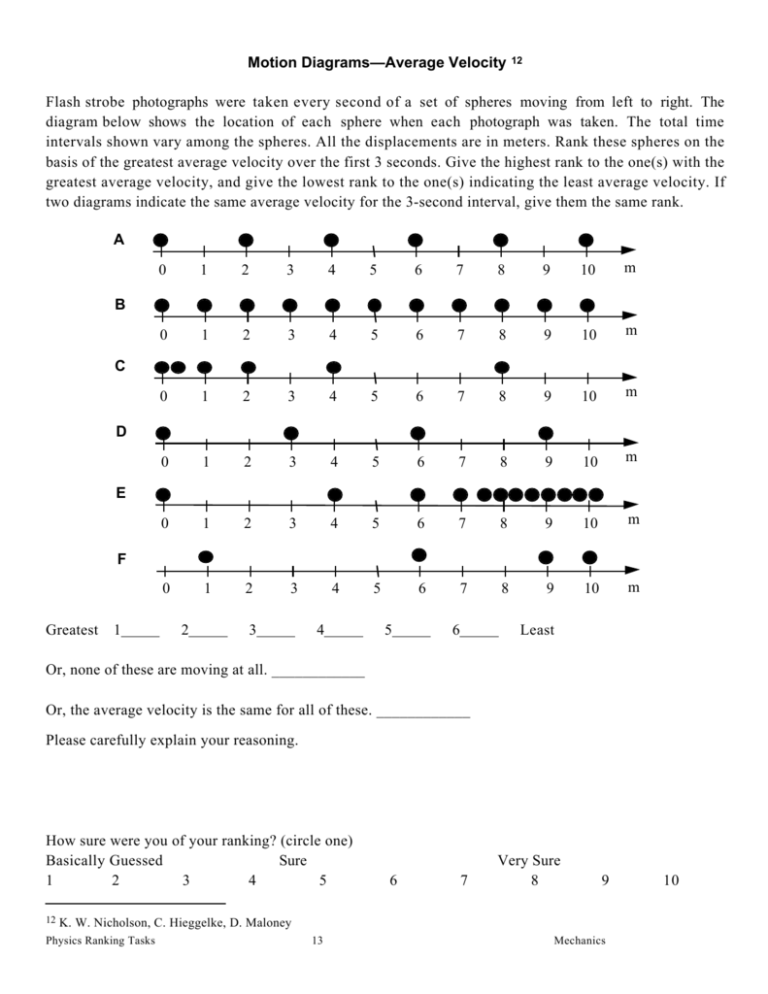
Motion Diagrams—Average Velocity 12 Flash strobe photographs were taken every second of a set of spheres moving from left to right. The diagram below shows the location of each sphere when each photograph was taken. The total time intervals shown vary among the spheres. All the displacements are in meters. Rank these spheres on the basis of the greatest average velocity over the first 3 seconds. Give the highest rank to the one(s) with the greatest average velocity, and give the lowest rank to the one(s) indicating the least average velocity. If two diagrams indicate the same average velocity for the 3-second interval, give them the same rank. A 0 1 2 3 4 5 6 7 8 9 10 m 0 1 2 3 4 5 6 7 8 9 10 m 0 1 2 3 4 5 6 7 8 9 10 m 0 1 2 3 4 5 6 7 8 9 10 m 0 1 2 3 4 5 6 7 8 9 10 m 0 1 2 3 4 5 6 7 8 9 10 m B C D E F Greatest 1 2 3 4 5 6 Least Or, none of these are moving at all. ____________ Or, the average velocity is the same for all of these. ____________ Please carefully explain your reasoning. How sure were you of your ranking? (circle one) Basically Guessed Sure 1 2 3 4 5 12 6 7 Very Sure 8 9 K. W. Nicholson, C. Hieggelke, D. Maloney Physics Ranking Tasks 13 Mechanics 10
