1.3 Constant Velocity worksheet 3
advertisement
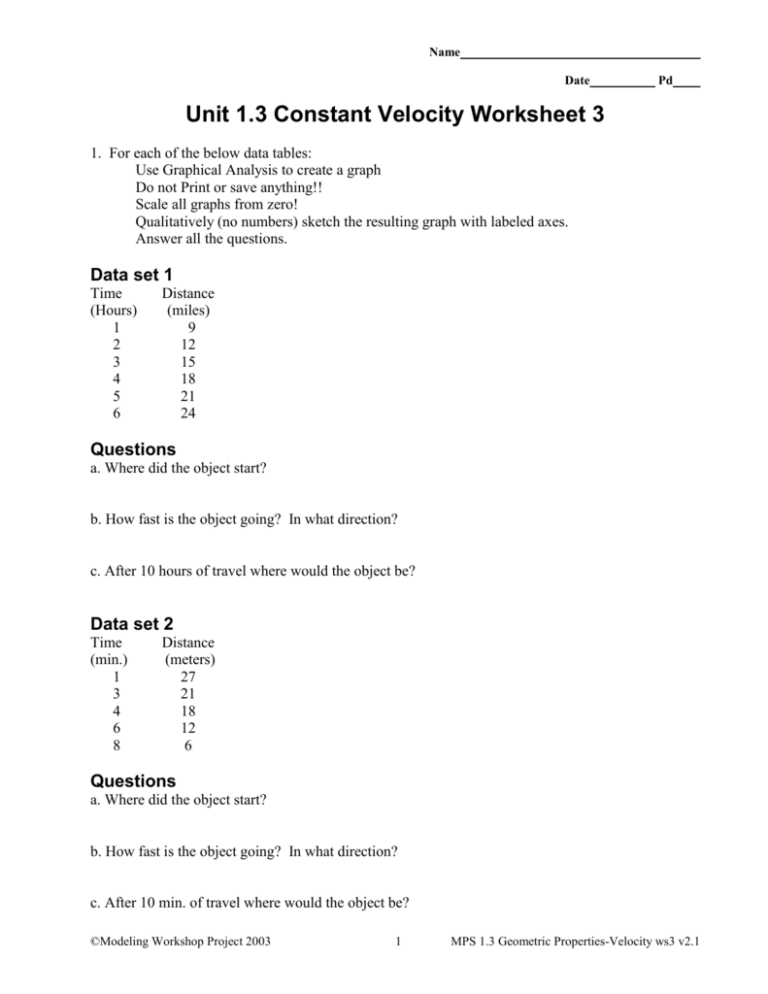
Name Date Pd Unit 1.3 Constant Velocity Worksheet 3 1. For each of the below data tables: Use Graphical Analysis to create a graph Do not Print or save anything!! Scale all graphs from zero! Qualitatively (no numbers) sketch the resulting graph with labeled axes. Answer all the questions. Data set 1 Time (Hours) 1 2 3 4 5 6 Distance (miles) 9 12 15 18 21 24 Questions a. Where did the object start? b. How fast is the object going? In what direction? c. After 10 hours of travel where would the object be? Data set 2 Time (min.) 1 3 4 6 8 Distance (meters) 27 21 18 12 6 Questions a. Where did the object start? b. How fast is the object going? In what direction? c. After 10 min. of travel where would the object be? ©Modeling Workshop Project 2003 1 MPS 1.3 Geometric Properties-Velocity ws3 v2.1 Data set 3 Time Distance (Seconds) (meters) 1 3 2 0 4 6 6 12 7 15 Questions a. Where did the object start? b. How fast is the object going? In what direction? c. After 10 seconds of travel where would the object be? Velocity (m/s) Position (m) 2. For the following Position-time graphs create the appropriate velocity-time graph. ©Modeling Workshop Project 2003 Velocity (m/s) Time (s) Time (s) Velocity (m/s) Position (m) Position (m) Time (s) Time (s) 2 MPS 1.3 Geometric Properties-Velocity ws3 v2.1


