TAP 206- 1: An experimental velocity
advertisement
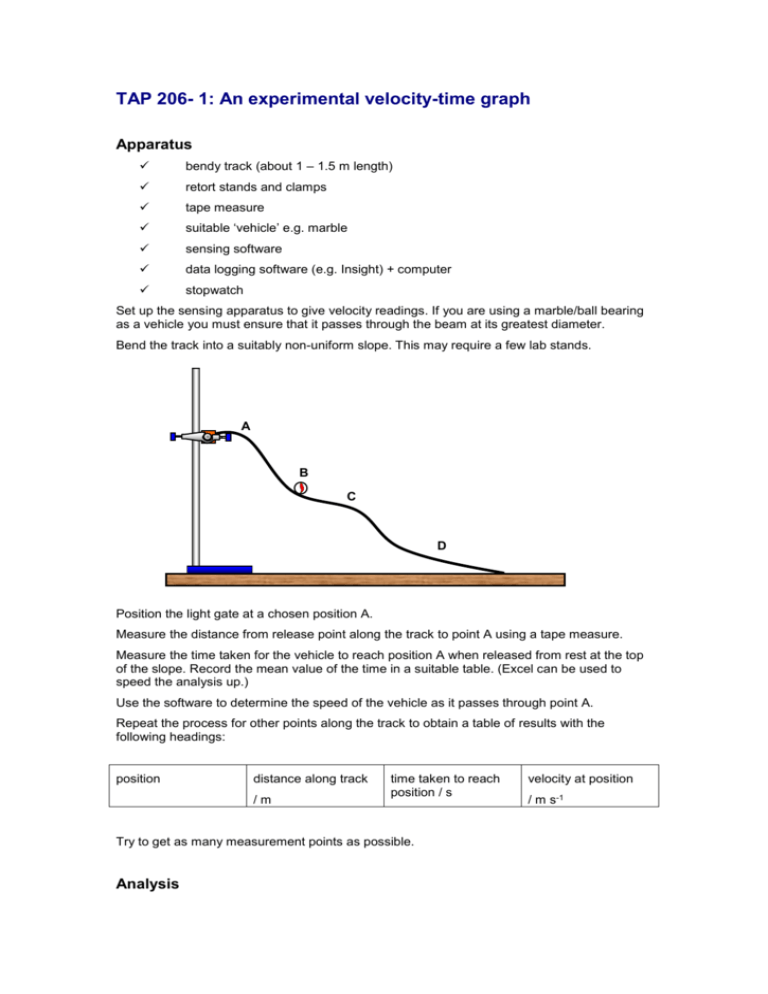
TAP 206- 1: An experimental velocity-time graph Apparatus bendy track (about 1 – 1.5 m length) retort stands and clamps tape measure suitable ‘vehicle’ e.g. marble sensing software data logging software (e.g. Insight) + computer stopwatch Set up the sensing apparatus to give velocity readings. If you are using a marble/ball bearing as a vehicle you must ensure that it passes through the beam at its greatest diameter. Bend the track into a suitably non-uniform slope. This may require a few lab stands. A B C D Position the light gate at a chosen position A. Measure the distance from release point along the track to point A using a tape measure. Measure the time taken for the vehicle to reach position A when released from rest at the top of the slope. Record the mean value of the time in a suitable table. (Excel can be used to speed the analysis up.) Use the software to determine the speed of the vehicle as it passes through point A. Repeat the process for other points along the track to obtain a table of results with the following headings: position distance along track /m time taken to reach position / s Try to get as many measurement points as possible. Analysis velocity at position / m s-1 Plot velocity-time and distance-time graphs of the results. Measure the area under the velocity-graph – this should approximate to the length of the track to the last point. Draw a tangent to the line at a suitable point on the distance–time graph. The gradient will yield the velocity which can be compared to the velocity-time graph.
