Supplemental 1
advertisement
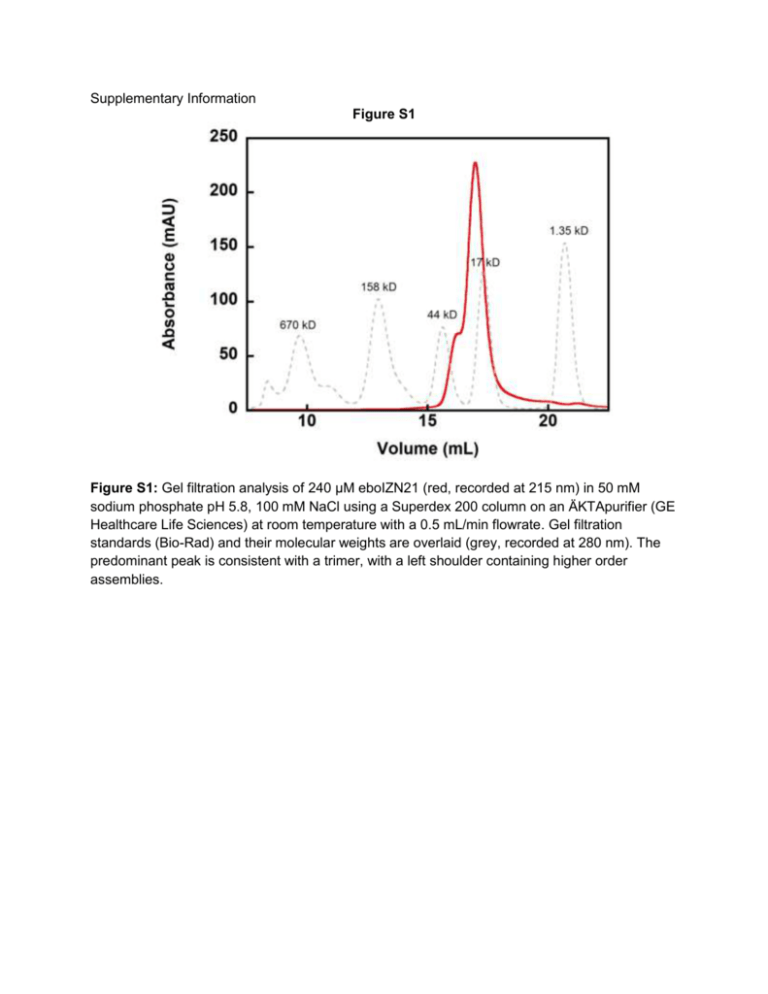
Supplementary Information Figure S1 Figure S1: Gel filtration analysis of 240 µM eboIZN21 (red, recorded at 215 nm) in 50 mM sodium phosphate pH 5.8, 100 mM NaCl using a Superdex 200 column on an ÄKTApurifier (GE Healthcare Life Sciences) at room temperature with a 0.5 mL/min flowrate. Gel filtration standards (Bio-Rad) and their molecular weights are overlaid (grey, recorded at 280 nm). The predominant peak is consistent with a trimer, with a left shoulder containing higher order assemblies. Figure S2 Figure S2: Binding of the ebolavirus C-peptide to the N-trimer mimic. Sensorgram of eboC24 flowed over eboIZN39IQ in a triplicate 2-fold dilution series starting at 800 nM (ProteOn XPR36, Bio-Rad), plotted with 2nd order 2-neighbor-smoothing with a Savitzky-Golay filter (Prism 6, GraphPad Software). Each dilution is shown as a distinct color. Equilibrium response data were averaged over one minute and fitted using non-linear least-squares analysis with Prism 6. The fit indicates a KD of 310 nM. Inset: The same eboC24 dilutions flowed over an eboIZN39IQ(D3) surface. No binding was observed. Figure S3 Figure S3: Hydrophobic interactions between N21 residues in the unliganded eboIZN21 structure. Shown is an overlay of the N21 region of available ebolavirus N-trimer structures in a similar view to that in Fig. 5B. Residues L569, L571, F572, L573, and T576 adopt alternate conformations in the unliganded state compared to the structures containing C-peptide and form hydrophobic interactions among themselves in the absence of ligand (dotted black lines; hydrophobic interactions for the C-peptide containing structures are not shown). Figure S4 Figure S4: Comparison of hydrophobic pockets in ebolavirus and HIV N-trimers. A) Surface representation of the N17 region comprising a hydrophobic pocket in the HIV gp41 N-trimer (orange) including a cartoon representation of the eight residues (8-mer, red) of the HIV Cpeptide that interact with the pocket. C-peptide residues that specifically contact pocket-forming residues are shown as sticks. The bottom panel is the same view as the top panel but without the ligand shown. B) A similar view of the HIV gp41 pocket but with the D-peptide ligand, PIE12 (dark red), bound. A comparison of the C-peptide-bound and PIE12-bound pockets indicates the shape of the pocket is ligand induced. C) A similar view of the ebolavirus N21 region (blue) from the 1EBO crystal structure showing the hydrophobic pocket with and without the 8-mer region of the ebolavirus C-peptide (dark blue) that interacts with the pocket. Figure S5 Figure S5: Mirror-Image Phage Display. In mirror-image phage display, the peptide/protein target is synthesized with D-amino acids (D-target) and forms the mirror-image of the natural Ltarget. Phage expressing a library of natural L-peptides (L-phage) are screened for binding to the D-target. The peptides from the specific phage clone binders are then synthesized with Damino acids (mimicking a D-phage), and by the law of symmetry, the D-peptides will bind the natural L-target (adapted from (36)). Figure S6 Figure S6: Synthesis of D-eboIZN39IQ. A) D-eboIZN39IQ (101 AA, with N-terminal biotin) was assembled using native chemical ligation and metal-free desulfurization. The native alanines and the residues used to replace them for native chemical ligation are indicated (red). B) HPLC analysis of final purified product D-eboIZN39IQ, using XBridge BEH130 C18 column, 2.1 x 50 mm, 5 to 90% acetonitrile gradient over 14 min, (c) MS validation showing final product with correct mass. Figure S7 Figure S7: Biophysical characterization of the D-versions of the Ebola N-trimer mimics. A) CD spectrum of 10 µM D-eboIZN21 at 4 °C in 50 mM sodium phosphate pH 5.8, 150 mM NaCl is indicative of a highly helical conformation with 80% helicity. The positive values are as expected for this mirror-image helix. B) Analysis of binding of D-eboC37 to D-eboIZN39IQ via SPR (Biacore 3000). D-eboC37 was flowed over D-eboIZN39IQ (and D-eboIZN39IQ(D3); inset) in a 7-member 2-fold dilution series starting at 60 nM in duplicate. The fit indicates a KD of 5.8 nM. No binding was observed to D-eboIZN39IQ(D3). SPR methods: SPR analysis was conducted on a CM5 sensor chip (GE Healthcare) loaded with ~10,000 RU streptavidin followed by capturing ~400 RU biotin-D-eboIZN39IQ (at 40 nM in PBST* running buffer). Using Kinject, a 2-fold dilution series of D-eboC37 was flowed over the chip in duplicate at RT starting at 60 nM. A five minute dissociation time was used to ensure the response fully recovered to baseline prior to the next injection. Table S1: eboIZN21 crystallographic data and refinement statistics Data Space Group (a, b, c) Resolution (Å) Resolution (Å) (high-resolution shell) # Reflections measured # Unique reflections Redundancy Completeness (%) <I/I> Mosaicity (o) Rpima P321 (38.51, 38.51, 72.59) 40.0 – 2.15 (2.23 – 2.15) 94,206 3,680 25.6 99.9 (99.7) 18 (1.9) 0.68 0.010 (0.234) Refinement Resolution (Å) Resolution (Å) – (high-resolution shell) # Reflections used for refinement # Reflections in Rfree set Rcrystb Rfreec RMSD: bonds (Å) / angles (°) <B> (Å2): protein atoms / # non-hydrogen atoms <B> (Å2): water molecules / # water molecules / most favored (%) / additionally allowed (%) 20.0 – 2.15 (2.46 – 2.15) 3,281 355 0.272 (0.316) 0.294 (0.432) 0.002 / 0.503 63.0 / 434 59.7 / 6 96 / 4 Values in parenthesis refer to data in the high resolution shell. a Rpim = SQRT(1/N-1)*|I-<I>|/I where I is the intensity of an individual measurement and <I> is the corresponding mean value. b Rcryst = ||Fo|-|Fc||/|Fo|, where |Fo| is the observed and |Fc| the calculated structure factor amplitude. c Rfree is the same as Rcryst calculated with a randomly selected test set of reflections that were never used in refinement calculations.
