Small angle X-ray scattering analysis of intrinsically disordered
advertisement
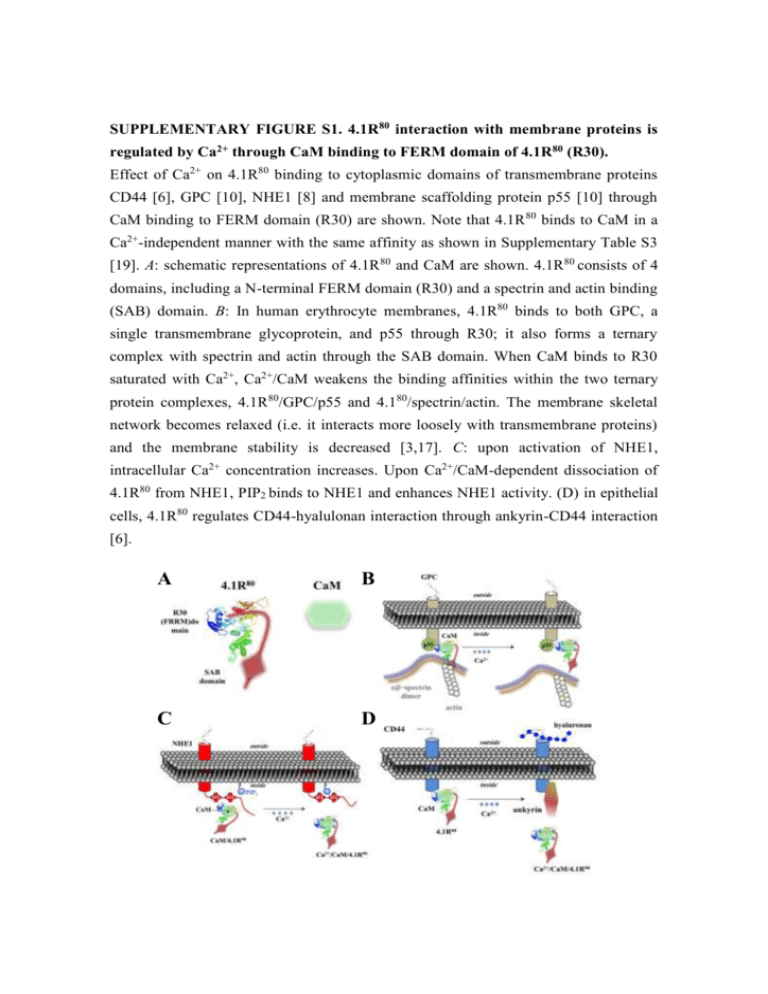
SUPPLEMENTARY FIGURE S1. 4.1R80 interaction with membrane proteins is regulated by Ca2+ through CaM binding to FERM domain of 4.1R 80 (R30). Effect of Ca2+ on 4.1R80 binding to cytoplasmic domains of transmembrane proteins CD44 [6], GPC [10], NHE1 [8] and membrane scaffolding protein p55 [10] through CaM binding to FERM domain (R30) are shown. Note that 4.1R 80 binds to CaM in a Ca2+-independent manner with the same affinity as shown in Supplementary Table S3 [19]. A: schematic representations of 4.1R 80 and CaM are shown. 4.1R80 consists of 4 domains, including a N-terminal FERM domain (R30) and a spectrin and actin binding (SAB) domain. B: In human erythrocyte membranes, 4.1R80 binds to both GPC, a single transmembrane glycoprotein, and p55 through R30; it also forms a ternary complex with spectrin and actin through the SAB domain. When CaM binds to R30 saturated with Ca2+, Ca2+/CaM weakens the binding affinities within the two ternary protein complexes, 4.1R80/GPC/p55 and 4.180/spectrin/actin. The membrane skeletal network becomes relaxed (i.e. it interacts more loosely with transmembrane proteins) and the membrane stability is decreased [3,17]. C: upon activation of NHE1, intracellular Ca2+ concentration increases. Upon Ca2+/CaM-dependent dissociation of 4.1R80 from NHE1, PIP2 binds to NHE1 and enhances NHE1 activity. (D) in epithelial cells, 4.1R80 regulates CD44-hyalulonan interaction through ankyrin-CD44 interaction [6]. A B C D SUPPLEMENTARY FIGURE S2. NMR structural changes in apo-CaM and Ca2+/CaM upon interaction with pep11. Changes in NMR (1H-15N HSQC) spectral profiles for specific amino acids in 15N-labelled apo-CaM (A) and Ca2+/CaM (B) upon pep11 binding are shown. Spectra for the pep11/apo-CaM and pep11/Ca2+/CaM complexes were measured at a 1:1.5 ratio. All samples were adjusted at pH 6.8 and kept at 25°C during the experiments. Spectra for the pep11/apo-CaM and pep11/Ca2+/CaM complexes were measured at a 1:1.5 ratio. All samples were adjusted at pH 6.8 and kept at 25°C during the experiments. A B - 105 +Ca2+ G33 G40 without pep11 G113 T29 G98 G25 G61 V55 T62 G132 G96 G23 with pep11 T44 G134 T26 D58 D95 T5 - 110 S17 D22 M145 T117 T110 T28 R106 N53 F65 Q135 T70 F19 - 115 S81 E127 M109 M72 R74 V91 15 E83 - 120 L18 L105 D118 R86 A102 D78 A73 S101 F68 K115 K21 L116 F141 - 125 A147 V136 I100 K94 I27 K148 D64 N137 I130 - 130 blue; residues in the N-lobe A57 green; residues in the C-lobe - - - - - 10 9 8 7 1 2 - 135 11 H (ppm) N (ppm) A128 F16 SUPPLEMENTARY FIGURE S3. Predicted hydrophobic residues in the C-lobe of CaM represented as a 3D structure. The residues in pep11 involved in interaction with CaM are represented as a ball-stick model in blue; the residues involved in Ca2+ independent interaction are represented as a sphere: L116 residue in yellow, A128 residue in brown, F141 residue in blue, M145 residue in green and A147 residue in magenta. Location of the amino acid residue in CaM involved in CaM binding to pep11, N137 in the -sheet when complexed with Ca2+ (PDB Accession ID: 1CFL for apo-CaM and 1CLL for Ca2+/CaM), is also shown. N137 138 N y Figure S4. l. apo-CaM A128 F141 A147 M145 L116 137 N N138 Ca A128 F141 Ca2+/CaM M145 L116 3 A147 Kd for the interactions of CaM with R30 (Table S1) and pep11 (Table S2) in the absence (EGTA) or presence (Ca2+) of Ca2+ from one of our previous reports [19] are shown. Each analyte (used from 50nM to 2 µM) was incubated with the listed ligands immobilized on aminosilane cuvettes. Interactions of R30 or pep11 with CaM in the presence or absence of Ca2+ were examined using the IAsys ® resonant mirror detection system as previously described [19,20]. Dissociation constants at equilibrium (termed “Kd”) were calculated using the equation: Kd= kd ka-1, where ka is the association rate constant and kd the dissociation rate constant. Kd values were obtained from the means of 3-5 measurements for ka and kd. From the binding curves obtained by the resonant mirror detection method, Kd were determined using the software package FAST-Fit ®. From the binding curves obtained by the resonant mirror detection method, Kd were determined using the software package FAST-Fit ®. ka, kd and Kd were calculated from three independent and representative experiments (mean±S.D.). ΔG°=RTlnKd、R=8.314 JK-1 mol-1, T / K. 4 Previously published results [6,8,10] about the effect of Ca2+/CaM on the affinity (Kd) of R30 binding to the cytoplasmic domain of transmembrane proteins CD44 [6], GPC [10] and NHE1 [8] and to membrane-associated protein p55 [10] are shown. R30 was complexed or not with CaM then incubated at various concentrations (50 nM to 1 µM) with the cytoplasmic domain of various transmembrane proteins immobilized on an aminosilane cuvette in the absence (EGTA) or presence (Ca2+) of Ca2+ as described in the Experimental section. Interactions of pep11 with CaM in the presence and absence of Ca2+ and CaM were examined using the IAsys ® resonant mirror detection system described as previously reported [19,20]. Dissociation constants at equilibrium (termed “Kd”) were calculated using the equation: Kd= kd ka-1, where ka is the association rate constant and kd the dissociation rate constant. Kd values were obtained from the means of 3-5 measurements for ka and kd. From the binding curves obtained by the resonant mirror detection method, Kd were determined using the software package FAST-Fit ®. ka, kd and Kd were calculated from three independent and representative experiments (mean±S.D.). ΔG°=RTlnKd、R=8.314 JK-1 mol-1, T/K. Binding assays were performed at 25°C. 5 Previously published results related to the Kd of pep11/CaM complex binding to pep9 are shown [19]. pep11/CaM complex (analyte used at 50nM to 2 µM) was incubated with pep9 (ligands) immobilized on aminosilane cuvettes. Interactions of pep11/CaM complex with pep9 in the presence and absence of Ca2+ were examined using the IAsys® resonant mirror detection system as previously described [19]. Dissociation constants at equilibrium (termed “Kd”) were calculated using equation: Kd = kd / ka, where ka is the association rate constant and kd the dissociation rate constant. Kd values were obtained from the means of 3-5 measurements for ka and kd. From the binding curves obtained by the resonant mirror detection method, Kd were determined using the software package FAST-Fit®. ka, kd and Kd were calculated from three independent and representative experiments (mean±S.D.). ΔG°=RTlnKd 、 R=8.314 JK-1 mol-1, T /K. Binding assays were performed at 25°C. 6
