EDTA Titration of the Hardness of Water
advertisement
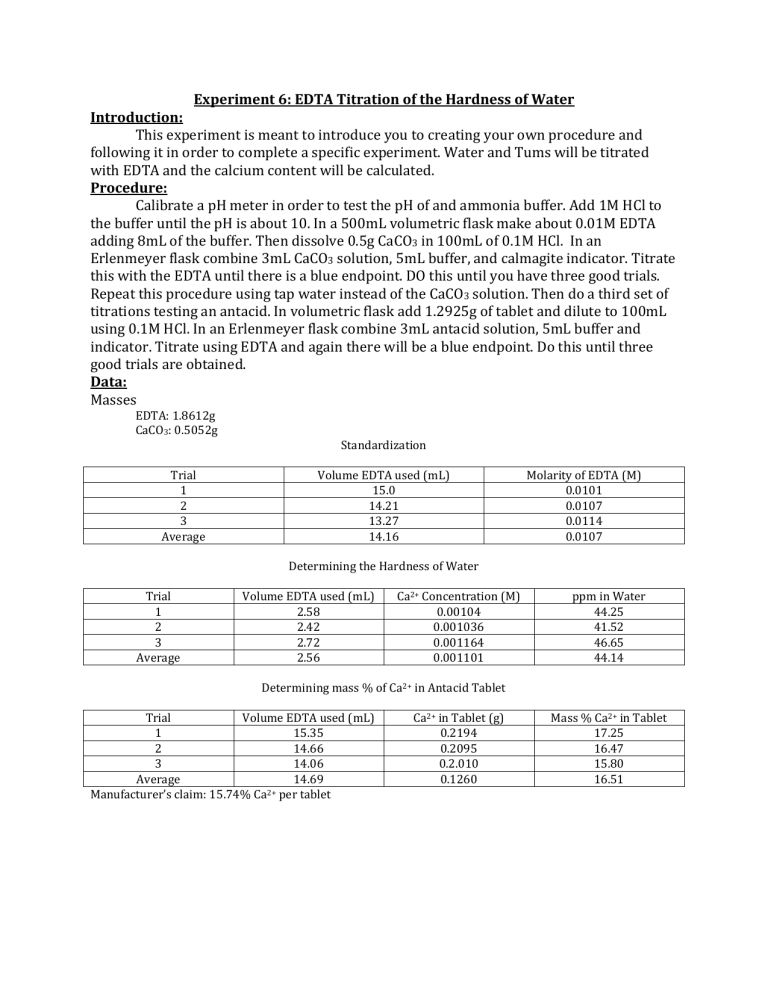
Experiment 6: EDTA Titration of the Hardness of Water Introduction: This experiment is meant to introduce you to creating your own procedure and following it in order to complete a specific experiment. Water and Tums will be titrated with EDTA and the calcium content will be calculated. Procedure: Calibrate a pH meter in order to test the pH of and ammonia buffer. Add 1M HCl to the buffer until the pH is about 10. In a 500mL volumetric flask make about 0.01M EDTA adding 8mL of the buffer. Then dissolve 0.5g CaCO3 in 100mL of 0.1M HCl. In an Erlenmeyer flask combine 3mL CaCO3 solution, 5mL buffer, and calmagite indicator. Titrate this with the EDTA until there is a blue endpoint. DO this until you have three good trials. Repeat this procedure using tap water instead of the CaCO3 solution. Then do a third set of titrations testing an antacid. In volumetric flask add 1.2925g of tablet and dilute to 100mL using 0.1M HCl. In an Erlenmeyer flask combine 3mL antacid solution, 5mL buffer and indicator. Titrate using EDTA and again there will be a blue endpoint. Do this until three good trials are obtained. Data: Masses EDTA: 1.8612g CaCO3: 0.5052g Standardization Trial 1 2 3 Average Volume EDTA used (mL) 15.0 14.21 13.27 14.16 Molarity of EDTA (M) 0.0101 0.0107 0.0114 0.0107 Determining the Hardness of Water Trial 1 2 3 Average Volume EDTA used (mL) 2.58 2.42 2.72 2.56 Ca2+ Concentration (M) 0.00104 0.001036 0.001164 0.001101 ppm in Water 44.25 41.52 46.65 44.14 Determining mass % of Ca2+ in Antacid Tablet Trial Volume EDTA used (mL) 1 15.35 2 14.66 3 14.06 Average 14.69 Manufacturer’s claim: 15.74% Ca2+ per tablet Ca2+ in Tablet (g) 0.2194 0.2095 0.2.010 0.1260 Mass % Ca2+ in Tablet 17.25 16.47 15.80 16.51 Calculations: Grams of EDTA needed 𝑀𝑜𝑙𝑎𝑟 𝑚𝑎𝑠𝑠 𝐸𝐷𝑇𝐴 𝑀𝑑𝑒𝑠𝑖𝑟𝑒𝑑 ∗ 𝑉𝑑𝑒𝑠𝑖𝑟𝑒𝑑 ∗ = 𝑔 𝑛𝑒𝑒𝑑𝑒𝑑 1 𝑚𝑜𝑙 𝐸𝐷𝑇𝐴 Molarity of EDTA 𝑀 𝐶𝑎𝐶𝑂3 ∗ 𝑉 𝐶𝑎𝐶𝑂3 ∗ 1 = 𝑀 𝐸𝐷𝑇𝐴 𝑉 𝐸𝐷𝑇𝐴 Moles of CaCO3 1 𝑚𝑜𝑙 𝐶𝑎𝐶𝑂3 𝑔𝐶𝑎𝐶𝑂3 ∗ = 𝑚𝑜𝑙 𝐶𝑎𝐶𝑂3 100.087𝑔 Molarity of CaCO3 𝑚𝑜𝑙𝑒𝑠 𝐶𝑎𝐶𝑂3 =𝑀 𝑉 Moles of EDTA 𝑉𝑢𝑠𝑒𝑑 ∗ 𝑀 𝑜𝑓 𝐸𝐷𝑇𝐴 = 𝑚𝑜𝑙𝑒𝑠 Ca2+ Concentration in Tap water 0.0505𝑀 𝐶𝑎𝐶𝑂3 ∗ 0.003𝑚𝐿𝐶𝑎𝐶𝑂3 1 ∗ = 0.0101𝑀 𝐸𝐷𝑇𝐴 0.01500𝑚𝐿𝐸𝐷𝑇𝐴 Moles of CaCO3 Example 0.5052𝑔 ∗ 1 𝑚𝑜𝑙 𝐶𝑎𝐶𝑂3 = 0.005048𝑚𝑜𝑙 𝐶𝑎𝐶𝑂3 100.087𝑔 Molarity of CaCO3 Example 0.005048𝑚𝑜𝑙𝑒𝑠 𝐶𝑎𝐶𝑂3 = 0.0505𝑀 0.100𝐿 Moles of EDTA Example 0.00258 ∗ 0.01𝑀 𝑜𝑓 𝐸𝐷𝑇𝐴 = 0.000028𝑚𝑜𝑙𝑒𝑠 Ca2+ Concentration in Tap water for Trial 1 Hardness of Water 𝑀𝑜𝑙𝑎𝑟 𝑚𝑎𝑠𝑠 1000𝑚𝑔 ̅∗ 𝐶𝑎2+ 𝑀 ∗ = 𝑝𝑝𝑚 1 𝑚𝑜𝑙 1𝑔 1 𝑚𝑜𝑙 𝐶𝑎2+ 1 𝑚𝑜𝑙 ∗ = 0.001104𝑀 1 𝑚𝑜𝑙 𝐸𝐷𝑇𝐴 0.025𝐿 Hardness of Water example 40.078𝑔 1000𝑚𝑔 0.001101𝑀 ∗ ∗ = 44.13 𝑝𝑝𝑚 1 𝑚𝑜𝑙 1𝑔 Mass % Ca2+ expected in tablet Mass % Ca2+ expected in tablet example 𝑉 𝐸𝐷𝑇𝐴 ∗ 𝑀 𝐸𝐷𝑇𝐴 ∗ 1 𝑚𝑜𝑙 𝐶𝑎2+ 1 𝑚𝑜𝑙 ∗ = 𝐶𝑎2+ 𝑐𝑜𝑛𝑐 1 𝑚𝑜𝑙 𝐸𝐷𝑇𝐴 𝑉 𝑤𝑎𝑡𝑒𝑟 Grams of EDTA needed Example 292.14𝑔 𝐸𝐷𝑇𝐴 0.01𝑀 ∗ 0.500𝐿 ∗ = 1.8616𝑔 𝑛𝑒𝑒𝑑𝑒𝑑 1 𝑚𝑜𝑙 𝐸𝐷𝑇𝐴 Molarity of EDTA for Trial 1 1𝑚𝑜𝑙 1𝑚𝑜𝑙 𝐶𝑎2+ 40.078𝑔 𝑔𝐶𝑎𝐶𝑂3 𝑖𝑛 𝑡𝑎𝑏 ∗ ∗ ∗ = 𝑔 𝐶𝑎2+ 100.0869𝑔 1𝑚𝑜𝑙 𝐶𝑎𝐶𝑂3 1𝑚𝑜𝑙 2+ 𝑔 𝐶𝑎 = 𝑚𝑎𝑠𝑠 % 𝑔 𝑡𝑎𝑏𝑙𝑒𝑡 Tums Tablet Experiment 𝑉 𝐸𝐷𝑇𝐴 ∗ 𝑀 𝐸𝐷𝑇𝐴 ∗ Percentage 1 𝑚𝑜𝑙 𝑀𝑜𝑙𝑎𝑟 𝑀𝑎𝑠𝑠 33.33 𝑝𝑎𝑟𝑡𝑠 ∗ ∗ =𝑔 1 𝑚𝑜𝑙 1 𝑚𝑜𝑙 𝑠𝑜𝑙𝑢𝑡𝑖𝑜𝑛 𝑚𝑎𝑠𝑠 𝑜𝑓 𝐶𝑎2+ 𝑐𝑎𝑙𝑐𝑢𝑙𝑎𝑡𝑒𝑑 ∗ 100 = % 𝑚𝑎𝑠𝑠 𝑜𝑓 𝑡𝑎𝑏𝑙𝑒𝑡 0.00258𝐿 ∗ 0.0107𝑀 ∗ 0.5𝑔𝐶𝑎𝐶𝑂3 ∗ 1𝑚𝑜𝑙 100.0869𝑔 ∗ 1𝑚𝑜𝑙 𝐶𝑎2+ 1𝑚𝑜𝑙 𝐶𝑎𝐶𝑂3 ∗ 40.078𝑔 1𝑚𝑜𝑙 2+ = 0.20023𝑔 𝐶𝑎2+ 0.20023𝑔 𝐶𝑎 = 15.74 % 1.2720𝑔 𝑡𝑎𝑏𝑙𝑒𝑡 Tums Tablet Experiment Example 0.01535𝐿 ∗ 0.0107𝑀 ∗ 1 𝑚𝑜𝑙 40.078𝑔 33.33 𝑝𝑎𝑟𝑡𝑠 ∗ ∗ = 0.2194𝑔 1 𝑚𝑜𝑙 1 𝑚𝑜𝑙 𝑠𝑜𝑙𝑢𝑡𝑖𝑜𝑛 Percentage for Trial 1 0.2194𝑔 ∗ 100 = 17.25% 1.2720𝑔 Conclusion: This lab had to objectives, to determine the Ca2+ concentration in tap water and the Ca2+ concentration in an antacid tablet and compare it to the manufacturer’s claims. After some calculations I found that since the manufacturer claimed there was 40% CaCO3 in each tablet there was 15.74% Ca2+ in each tablet. After the experiment our three trials gave a larger mass percent than expected according to the claims of the manufacturer. The percentages averaged at 16.51% which is a 4.89% error from the expected value. A source of error could have been from determining the end point because it would often go back to pink and not stay at the end color, which is blue. We may have added more titrant than needed thinking that it had yet to reach the end point but in reality it had. In the future maybe we should have recorded the volume of EDTA added when we first noticed a color change. Either way we were very close to the manufacturer’s claim and it is possible that the tablet could have had more calcium than expected. The other objective of this lab was to determine the hardness of tap water, amount of Ca2+, and we calculated there to be an average of 44.14ppm over our three trials.
