quant expt 9
advertisement
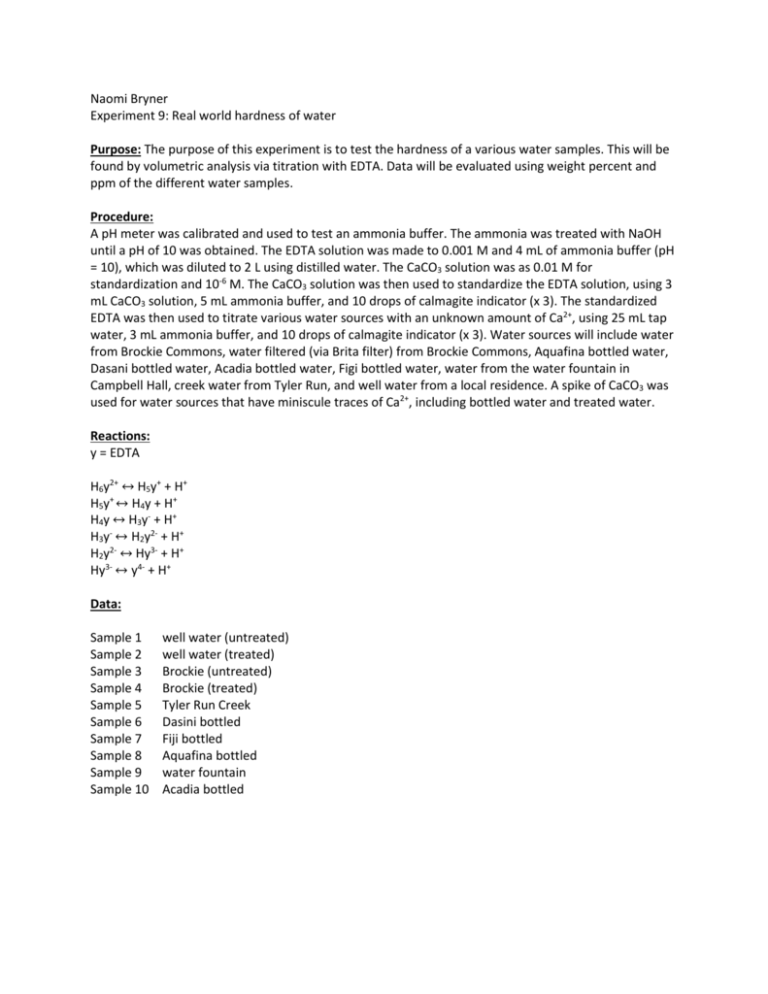
Naomi Bryner Experiment 9: Real world hardness of water Purpose: The purpose of this experiment is to test the hardness of a various water samples. This will be found by volumetric analysis via titration with EDTA. Data will be evaluated using weight percent and ppm of the different water samples. Procedure: A pH meter was calibrated and used to test an ammonia buffer. The ammonia was treated with NaOH until a pH of 10 was obtained. The EDTA solution was made to 0.001 M and 4 mL of ammonia buffer (pH = 10), which was diluted to 2 L using distilled water. The CaCO3 solution was as 0.01 M for standardization and 10-6 M. The CaCO3 solution was then used to standardize the EDTA solution, using 3 mL CaCO3 solution, 5 mL ammonia buffer, and 10 drops of calmagite indicator (x 3). The standardized EDTA was then used to titrate various water sources with an unknown amount of Ca2+, using 25 mL tap water, 3 mL ammonia buffer, and 10 drops of calmagite indicator (x 3). Water sources will include water from Brockie Commons, water filtered (via Brita filter) from Brockie Commons, Aquafina bottled water, Dasani bottled water, Acadia bottled water, Figi bottled water, water from the water fountain in Campbell Hall, creek water from Tyler Run, and well water from a local residence. A spike of CaCO3 was used for water sources that have miniscule traces of Ca2+, including bottled water and treated water. Reactions: y = EDTA H6y2+ ↔ H5y+ + H+ H5y+ ↔ H4y + H+ H4y ↔ H3y- + H+ H3y- ↔ H2y2- + H+ H2y2- ↔ Hy3- + H+ Hy3- ↔ y4- + H+ Data: Sample 1 Sample 2 Sample 3 Sample 4 Sample 5 Sample 6 Sample 7 Sample 8 Sample 9 Sample 10 well water (untreated) well water (treated) Brockie (untreated) Brockie (treated) Tyler Run Creek Dasini bottled Fiji bottled Aquafina bottled water fountain Acadia bottled Sample 1 pH = 6.87 Temp = 24 Ammonia pH 10.05 Sample 2 Spiked pH = 6.64 Temp = 24 Ammonia pH 10.05 Without Spike Sample 3 pH = 7.43 Temp = 25 Ammonia pH 9.95 Sample 4 Without Spike pH = 4.43 Temp = 24 Ammonia pH 10.01 Spiked Sample 5 Without Spike pH = 7.48 Temp = 24 Ammonia pH 10.01 EDTA (L) [Ca2+] Ca 2+ ppm Trial 1 0.02769 Trial 2 0.02742 Trial 3 0.02739 Average 0.0275 0.0014951 59.921143 EDTA (L) [Ca2+] Ca 2+ ppm Trial 1 0.02774 Trial 2 0.02499 Trial 3 0.02484 Average 0.025856667 0.0014058 56.340401 Trial 1 0.02461 Trial 2 0.02447 Trial 3 0.02399 Average 0.024356667 0.0013242 53.071975 EDTA (L) [Ca2+] Ca 2+ ppm Trial 1 0.01986 Trial 2 0.01958 Trial 3 0.0225 Average 0.020646667 0.0008401 33.6715 [Ca2+] EDTA (L) Ca 2+ ppm Trial 1 (rough) Trial 2 Trial 3 Trial 4 Average 0.0094 0.00809 0.00817 0.00819 0.00815 3.854E-07 0.0154445 Trial 1 Trial 2 Trial 3 Average 0.00852 0.00847 0.00851 0.0085 4.019E-07 0.0161078 EDTA (L) Trial 1 (rough) Trial 2 Trial 3 Trial 4 Average 0.03639 0.03745 0.0375 0.03714 0.037363333 [Ca2+] Ca 2+ ppm 1.767E-06 0.0708047 Sample 6 Spiked pH = 6.07 Temp = 24 Ammonia pH 10.01 Without Spike Sample 7 Spiked pH = 7.3 Temp = 24 Ammonia pH 10.01 Without Spike Sample 8 Spiked pH = 6.22 Temp = 24 Ammonia pH 10.06 Without Spike Sample 9 pH = 7.76 Temp = 25 Ammonia pH 9.99 Sample 10 Spiked pH = 6.85 Temp = 24 Ammonia pH 10.06 [Ca2+] EDTA (L) Trial 1 Trial 2 Trial 3 Average Trial 1 Trial 2 Trial 3 Average Trial 1 Trial 2 Trial 3 Average 0.00334 0.00344 0.00349 0.003423333 0.0034 0.00329 0.00359 0.003426667 EDTA (L) [Ca2+] 0.02804 0.02721 0.02828 0.027843333 Trial 1 Trial 2 Trial 3 Average 0.02685 0.02642 0.02632 0.02653 Ca 2+ ppm 1.619E-07 0.0064873 1.62E-07 0.0064936 Ca ppm 2+ 1.317E-06 0.052764 1.254E-06 0.0502752 [Ca2+] EDTA (L) Ca 2+ ppm Trial 1 Trial 2 Trial 3 Average 0.00022 0.00052 0.00038 0.000373333 1.621E-09 6.498E-05 Trial 1 Trial 2 Trial 3 Average 0.00032 0.00028 0.00059 0.000396667 1.723E-09 6.904E-05 [Ca2+] EDTA (L) Trial 1 (rough) Trial 2 Trial 3 Trial 4 Trial 5 Average 0.0213 0.01961 0.01999 0.01992 0.0198 0.01983 0.0008069 [Ca2+] EDTA (L) Trial 1 (rough) Trial 2 Trial 3 Trial 4 Average Ca 2+ ppm 0.0058 0.00534 0.00528 0.00537 0.00533 32.339644 Ca 2+ ppm 2.315E-08 0.0009278 Calculations: [EDTA] = [Ca2+] = M CaCO3 ∗L CaCO3 L EDTA [CaCO3 ]×VCaCO3 VWater = = 0.01M∗0.003L 0.02949L = 0.0010173M (0.0013592 M)×0.03 L 0.025 L = 0.00163 M Ca2+ ppm = 40078 X [Ca2+] = 40078 X 0.00163 = 65.37 ppm 95% CI = x ± t×s √n = 59.92 ± 3.182 × 0.165 √3 = [60.332, 59.511] known value−experimental value )× known value % error = ( 45.7−59.92114 )× 45.7 100% = ( 100% = 31.1% Results: 1 - Well U 2 - Well T 3 - Brockie U 4 - Brockie T 5 - creek 6 - Dasani 7 - Figi 8 - Aquafina 9- Fountain 10 - Acadia Experimental 59.92114 53.07198 33.6715 0.015445 0.070805 0.006494 0.050275 6.9E-05 32.33965 0.000899 Sample Source 1 Well water untreated Well water treated Brockie Commons water untreated Brockie Commons water treated Tyler Run water 2 3 4 5 6 7 8 9 10 Known 45.7 6.12 20.3 0.6902 0.02 0 18 0 20.3 20.3 Experimental mean 59.921 Reported value 45.7 % error 31.1 53.072 6.12 767.2 33.672 20.3 65.9 0.0154 0.6902 97.8 0.0708 0.02 254 Dasani bottled water Figi bottled water 0.00649 0 NA 0.0503 18 99.7 Aquafina bottled water Campbell Hall fountain water Acadia bottled water 0.000069 0 NA 32.340 20.3 59.3 0.000899 20.3 100 95% CI [60.332, 59.511] [52.880, 52.264] [37.674, 29.669] [0.147, -0.116] [0.555, -0.414] [0.384, -0.371] [0.750, -0.649] [0.419, -0.419] [32.753, 31.926] [0.536, -0.534] Relationship to reported value Lower Lower Lower Higher Within Within Higher Within Lower Higher Conclusions: The concentration of [Ca2+] was determined for multiple water samples, and from this the hardness of the water (ppm) was calculated. Experimentation seemed to go reasonably well. The main problem with this lab was that reported known values may not have all been valid or applicable. Manufacturers of Dasani and Aquafina did not report values online, and a phone call to customer service proved fruitless. Determining the reported concentration of untreated well water was also difficult, as little was known about the well sample. For treated water types, the Brita water filter was said to remove 96% of impurities. This was used for both treated water types. Obviously the blanket reported values did not fit the results, and more time should have been set aside to obtain individual reported values. There was adequate time for experimentation, but seeking out reported values had not been foreseen to take as much time and effort as it did.
