Lab 6: EDTA Titration of Water and Antacid Tablet Solution
advertisement
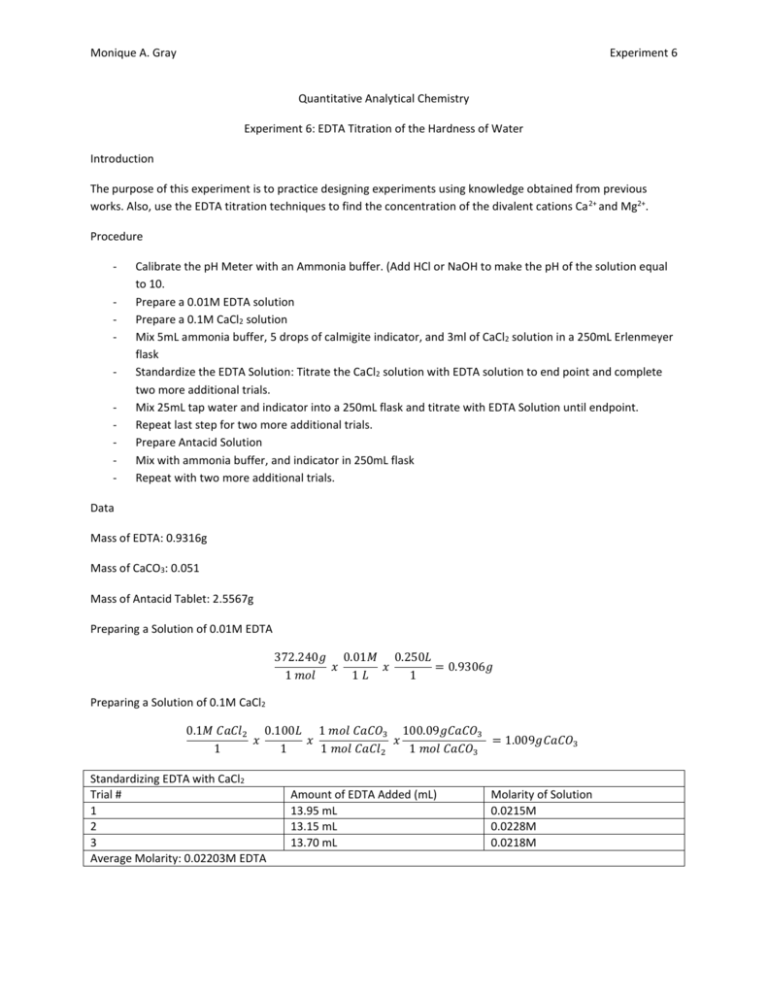
Monique A. Gray Experiment 6 Quantitative Analytical Chemistry Experiment 6: EDTA Titration of the Hardness of Water Introduction The purpose of this experiment is to practice designing experiments using knowledge obtained from previous works. Also, use the EDTA titration techniques to find the concentration of the divalent cations Ca 2+ and Mg2+. Procedure - Calibrate the pH Meter with an Ammonia buffer. (Add HCl or NaOH to make the pH of the solution equal to 10. Prepare a 0.01M EDTA solution Prepare a 0.1M CaCl2 solution Mix 5mL ammonia buffer, 5 drops of calmigite indicator, and 3ml of CaCl2 solution in a 250mL Erlenmeyer flask Standardize the EDTA Solution: Titrate the CaCl2 solution with EDTA solution to end point and complete two more additional trials. Mix 25mL tap water and indicator into a 250mL flask and titrate with EDTA Solution until endpoint. Repeat last step for two more additional trials. Prepare Antacid Solution Mix with ammonia buffer, and indicator in 250mL flask Repeat with two more additional trials. Data Mass of EDTA: 0.9316g Mass of CaCO3: 0.051 Mass of Antacid Tablet: 2.5567g Preparing a Solution of 0.01M EDTA 372.240𝑔 0.01𝑀 0.250𝐿 𝑥 𝑥 = 0.9306𝑔 1 𝑚𝑜𝑙 1𝐿 1 Preparing a Solution of 0.1M CaCl2 0.1𝑀 𝐶𝑎𝐶𝑙2 0.100𝐿 1 𝑚𝑜𝑙 𝐶𝑎𝐶𝑂3 100.09𝑔𝐶𝑎𝐶𝑂3 𝑥 𝑥 𝑥 = 1.009𝑔𝐶𝑎𝐶𝑂3 1 1 1 𝑚𝑜𝑙 𝐶𝑎𝐶𝑙2 1 𝑚𝑜𝑙 𝐶𝑎𝐶𝑂3 Standardizing EDTA with CaCl2 Trial # 1 2 3 Average Molarity: 0.02203M EDTA Amount of EDTA Added (mL) 13.95 mL 13.15 mL 13.70 mL Molarity of Solution 0.0215M 0.0228M 0.0218M Monique A. Gray Experiment 6 Find the Molarity of EDTA 3𝑚𝐿 CaCl2 0.100 𝐶𝑎2 + 1 𝑚𝑜𝑙 𝐸𝐷𝑇𝐴 1 𝑥 𝑥 𝑥 = 0.0215𝑀 1 1000 𝑚𝐿 1 𝑚𝑜𝑙 𝐶𝑎 2 + 0.01395 𝐿 Tap Water Data Trial # 1 2 3 Average Molarity: 0.002M Amount EDTA Added (mL) 2.68 mL 2.31 mL 2.25 mL Molarity of Ca2+ 0.00236M 0.00203M 0.00198M Finding the Calcium ion Molarity 0.00268𝐿 0.02203𝑀 1 𝑚𝑜𝑙 Ca2 + 1 𝑥 𝑥 𝑥 = 0.00236𝑀 1 1 1 𝑚𝑜𝑙 𝐸𝐷𝑇𝐴 0.025𝐿 Finding the ppm Concentration 0.00236𝑀 Ca2 + 40.078𝑔 1000𝑚𝑔 𝑥 𝑥 = 94.584 𝑝𝑝𝑚 1 1 𝑚𝑜𝑙 1𝑔 Antacid Tablet Data Trial # 1 2 3 Average grams of Ca2+: 0.4271g Amount EDTA Added (mL) 24.1 mL 24.21 mL 24.25mL Grams Ca2+ 0.4256g 0.4275g 0.4282g Grams claimed by manufacturer 0.051𝑔 𝐶𝑎𝐶𝑂3 1 𝑚𝑜𝑙 𝐶𝑎𝐶𝑂3 1 𝑚𝑜𝑙 40.078𝑔 𝑥 𝑥 𝑥 = 0.0204𝑔 1 100.09𝑔 𝐶𝑎𝐶𝑂3 1 𝑚𝑜𝑙 𝐶𝑎𝐶𝑂3 1 𝑚𝑜𝑙 Ca2 + 0.0204𝑔 𝑥 100 = 79.7% 2.5567𝑔 Experimental Calculated Grams of Calcium Ion 0.02410𝐿 0.02203𝑀 1 𝑚𝑜𝑙 𝑐𝑎2 + 40.078𝑔 Ca2 + 20 𝑝𝑎𝑟𝑡𝑠 𝑥 𝑥 𝑥 𝑥 = 0.4256 1 1 1 𝑚𝑜𝑙 𝐸𝐷𝑇𝐴 1 𝑚𝑜𝑙 Ca2 + 𝑠𝑜𝑙𝑢𝑡𝑖𝑜𝑛 Amount of Calcium in tablet 𝐴𝑣𝑒𝑟𝑎𝑔𝑒 𝑔𝑟𝑎𝑚𝑠 𝐶𝑎𝑙𝑐𝑖𝑢𝑚 𝑥 100 𝑡𝑜𝑡𝑎𝑙 𝑚𝑎𝑠𝑠 𝑜𝑓 𝑡𝑎𝑏𝑙𝑒𝑡 Monique A. Gray Experiment 6 0.4271𝑔 𝑥 100 = 16.705% 2.5567𝑔 Conclusion We found that our experiment showed that there was less calcium ion in the antacid tablet than what the manufacturer claimed. There might have been error associated with calculating the grams and overall percent for calcium ion for the manufacturer’s claimed value, thus, this could have hindered our results. We found that the hardness of water was significantly high in the tap water analyzed. The handling of the water could have contributed to the hardness. Letting water sit without flowing could have resulted in a mineral build up, which could have made water harder. Also, the type of pipes water flowed through could have contributed to the hardness because some ions come off more readily in water than others. Lastly, we could have been using city water and city water may not be as well maintained as compared to other areas.
