Soal UTS Business Statistics
advertisement
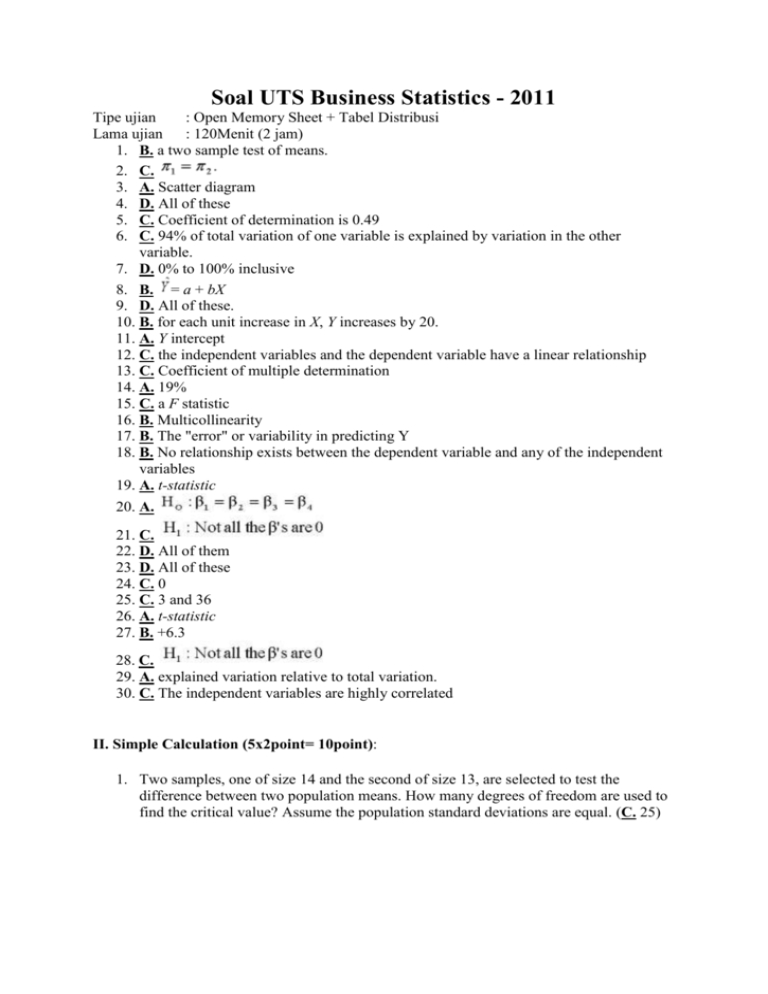
Soal UTS Business Statistics - 2011 Tipe ujian : Open Memory Sheet + Tabel Distribusi Lama ujian : 120Menit (2 jam) 1. B. a two sample test of means. 2. C. 3. A. Scatter diagram 4. D. All of these 5. C. Coefficient of determination is 0.49 6. C. 94% of total variation of one variable is explained by variation in the other variable. 7. D. 0% to 100% inclusive 8. B. = a + bX 9. D. All of these. 10. B. for each unit increase in X, Y increases by 20. 11. A. Y intercept 12. C. the independent variables and the dependent variable have a linear relationship 13. C. Coefficient of multiple determination 14. A. 19% 15. C. a F statistic 16. B. Multicollinearity 17. B. The "error" or variability in predicting Y 18. B. No relationship exists between the dependent variable and any of the independent variables 19. A. t-statistic 20. A. 21. C. 22. D. All of them 23. D. All of these 24. C. 0 25. C. 3 and 36 26. A. t-statistic 27. B. +6.3 28. C. 29. A. explained variation relative to total variation. 30. C. The independent variables are highly correlated II. Simple Calculation (5x2point= 10point): 1. Two samples, one of size 14 and the second of size 13, are selected to test the difference between two population means. How many degrees of freedom are used to find the critical value? Assume the population standard deviations are equal. (C. 25) 2. A hypothesis test is conducted at the .05 level of significance to test whether or not the population correlation is zero. If the sample consists of 25 observations and the correlation coefficient is 0.60, what is the computed value of the test statistic? D. 3.60 3. Given the least squares regression equation, does equal? C. 4601 4. If the regression equation is B. 3.2 = 1202 + 1,133X, when X = 3, what = 2 - 0.4X, what is the value of 5. Given a multiple linear regression equation when X = - 3? = 5.1 + 2.2X1 - 3.5X2, what will a unit increase in the independent variable, X2, mean in the change of things are held constant? ________ -3.5 assuming other III. Essay: (3x20point) 1. A sales manager for an advertising agency believes there is a relationship between the number of contacts and the amount of the sales. To verify this belief, the following data was collected: a. What is the dependent variable? C. Amount of sales , What is the independent variable? B. Number of contacts b. What is the regression equation? B. = -12.201 + 2.1946X c. What is the value of the standard error of estimate? A. 9.3104 d. What is the value of the coefficient of correlation? B. 0.9754 e. What is the value of the coefficient of determination? D. 0.9513 f. The 95% confidence interval for 30 calls is C. 46.7, 60.6 2. Calculate & answer the question from Regression result below: a. What is the standard error of the estimate? C. 11.6985 b. What is the correlation coefficient and coefficient of determination? A. 91.8% B. 0.958 c. The regression equation is? B. = -12.80894 + 2.179463 d. If testing the hypothesis: H0: = 0, the computed t – statistic! A. 9.45 e. Estimate the value of when X = 4. C. 8.20 3. The research is trying to find the best wage of the housemaid per month with independent variable total room, total floor and washing clothes facility. Based on summary output below, answer the question. SUMMARY OUTPUT Regression Statistics R R Square Adjusted R Square Standard Error Observations 0.964920346 0.931071274 0.921671903 51705.84701 26 ANOVA Regression Residual Total Intercept TOTAL ROOM(S) TOTAL FLOOR(S) WASHING CLOTHES FACILITY df 3 22 25 SS 7.94483E+11 58816881532 8.533E+11 Coefficients Standard Error 397886.7574 46357.87863 42755.08801 5622.920553 27212.94004 35940.38298 59493.94939 20863.56758 MS 2.64828E+11 2673494615 F ? t Stat 8.582937122 ? ? ? P-value 1.8E-08 1.36E-07 0.456982 0.009279 a. What is the computed value of “ F ” ? 99.05676 b. What is the computed value of “ t ” statistic for total room, total floor and washing clothes facility ? total room = 7.603715472 , total floor = 0.757168894 and washing clothes facility = 2.851571246. c. Explain the F test and t test, is it reject or accept H0 and the conclusion? d. Made one of the best regression equation that possible. e. Compute & analyze the VIF for all independent variabel. SUMMARY OUTPUT Regression Statistics Multiple R 0.964920346 R Square 0.931071274 Adjusted R Square 0.921671903 Standard Error 51705.84701 Observations 26 ANOVA df Regression Residual Total Significance SS MS F F 3 7.94483E+11 2.64828E+11 99.05676 6.24815E-13 22 58816881532 2673494615 25 8.533E+11 Coefficients Intercept TOTAL ROOM(S) Standard Error t Stat P-value Lower 95% 397886.7574 46357.87863 8.582937122 1.8E-08 301746.4014 42755.08801 5622.920553 7.603715472 1.36E-07 31093.86451 TOTAL FLOOR(S) 27212.94004 35940.38298 0.757168894 0.456982 47322.85228 WASHING CLOTHES FACILITY 59493.94939 20863.56758 2.851571246 0.009279 16225.55849


