L2: Lecture notes Regression and Correlation
advertisement
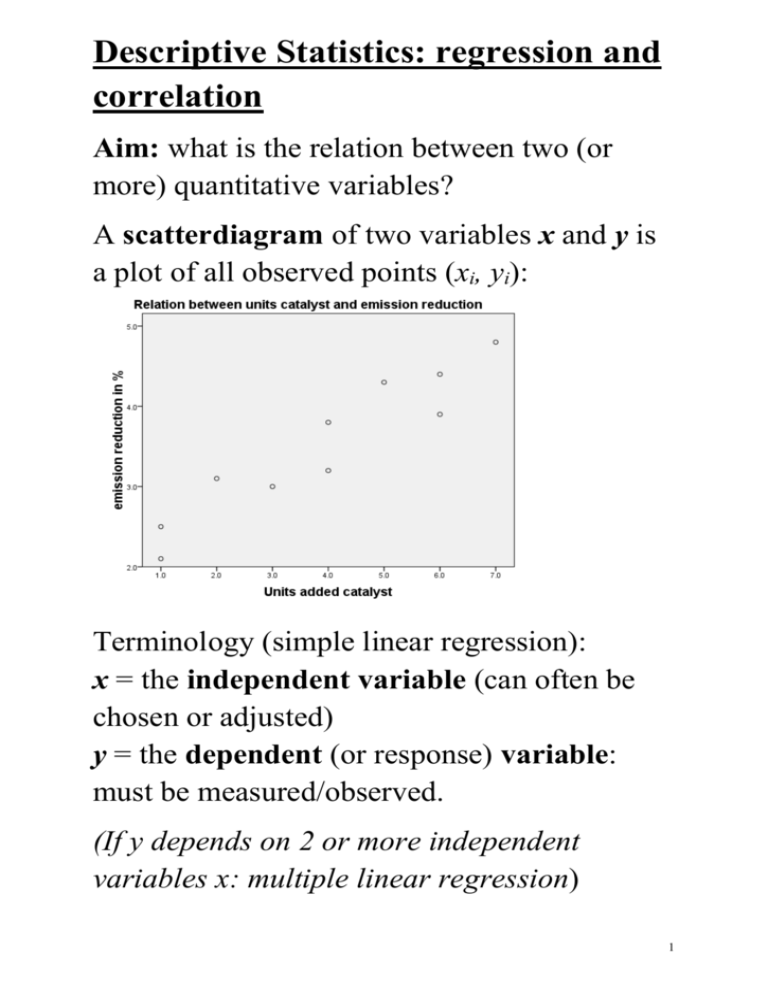
Descriptive Statistics: regression and correlation Aim: what is the relation between two (or more) quantitative variables? A scatterdiagram of two variables x and y is a plot of all observed points (xi, yi): Terminology (simple linear regression): x = the independent variable (can often be chosen or adjusted) y = the dependent (or response) variable: must be measured/observed. (If y depends on 2 or more independent variables x: multiple linear regression) 1 Interpretation: a linear relation if the points tend to group around a straight line. a linear relation is called positive (“large values of y coincide with large values of x and vice versa”) of negative. Beware of clusters: separate groups of points in the scatter diagram. De correlation coefficient r is a measure of the strength of a linear relationship of the variables x and y, based on n observations (x1, y1), ... ,(xn, yn): Definition: Formula for computations: n = is the number of observations (xi, yi) and are the sample mean and standard deviation of the xi`s and yi`s. Σ xiyi: sum of all products xi×yi Properties r: 1. -1 ≤ r ≤ +1 2. r = -1 or r = 1: the relation is strictly linear 2 3. r is not resistant (sensitive for outliers) 4. r does not depend on the unit of measurement of x or y ( r is scaleless) Interpretation of te value of r: r = 0: no linear relation r close to 0: weak linear relation r = +1: strictly positive linear relation r = -1: strictly negative linear relation r close to +1 (-1): strong positive (negative) linear relation If there seems to be a linear relation we use the Method of least squares to fit a line to the observed points: the sum of all squared (vertical) distances of the points to the line y = ax + b is minimized. 3 The resulting line is called the (least squares) regression line or fitted line, a and b are called the least squares estimates: the y-intercept b = regression constant and the slope a = regression coefficient. The predicted response for given x* is Interpolation: if x* is within the range of the observations. Extrapolation: if x* is outside the range, e.g. in case of time series: predicting future values. Residual: the (vertical) distance between the observed point (xi, yi) and (xi, ) on the line: = Sum and mean of the residuals ei are 0 4 s 2 n1-2 ei 2 estimates the variance in the distances towards the regression line. Residual diagram: graph of all points (xi, ei): Possible comments on residual and/or overall diagram: Is there a pattern of the residuals/points indicating a non-linear relation? Are there outliers among the residuals? (use the 1.5×IQD-rule to determine outliers) Is/are there influential observation(s), e.g. a deviant x- or y-value r2 is called the coefficient of determination: The interpretation of r2 is “the percentage of the variation of the y-values that can be explained by the linear relation ” Correlation: cause or consequence? a strong relation between two variables does not always indicate a causal connection, e.g.: a third (hidden) variable can be related to 5 both. Specially designed experiments can reveal these relations. 6
