Math 95 – Lab 2 – Linear Regression
advertisement
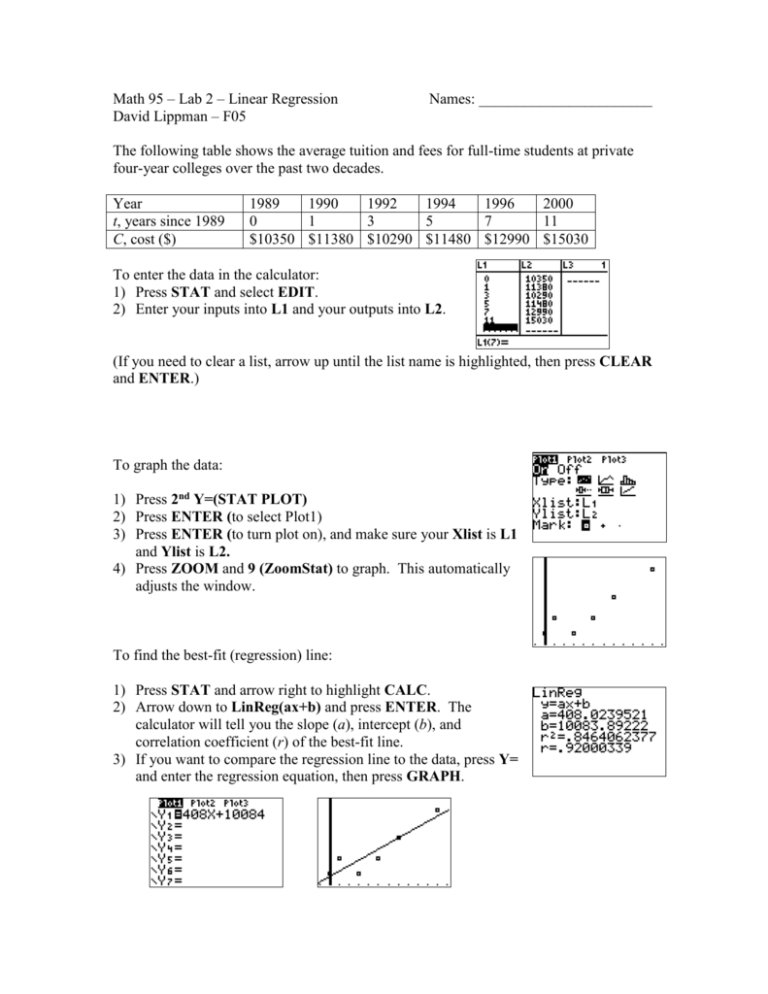
Math 95 – Lab 2 – Linear Regression David Lippman – F05 Names: _______________________ The following table shows the average tuition and fees for full-time students at private four-year colleges over the past two decades. Year t, years since 1989 C, cost ($) 1989 1990 1992 1994 1996 2000 0 1 3 5 7 11 $10350 $11380 $10290 $11480 $12990 $15030 To enter the data in the calculator: 1) Press STAT and select EDIT. 2) Enter your inputs into L1 and your outputs into L2. d (If you need to clear a list, arrow up until the list name is highlighted, then press CLEAR and ENTER.) To graph the data: 1) Press 2nd Y=(STAT PLOT) 2) Press ENTER (to select Plot1) 3) Press ENTER (to turn plot on), and make sure your Xlist is L1 and Ylist is L2. 4) Press ZOOM and 9 (ZoomStat) to graph. This automatically adjusts the window. To find the best-fit (regression) line: 1) Press STAT and arrow right to highlight CALC. 2) Arrow down to LinReg(ax+b) and press ENTER. The calculator will tell you the slope (a), intercept (b), and correlation coefficient (r) of the best-fit line. 3) If you want to compare the regression line to the data, press Y= and enter the regression equation, then press GRAPH. d d d d d The following table gives the life expectancy at birth (in years) for an American born in the given years. Year of Birth Life Expectancy 1975 72.6 1980 73.7 1985 74.7 1990 75.4 1996 76.1 2000 76.9 1) Use regression to find a linear equation for the life expectancy as a function of the year of birth. (I would recommend using something like “t: years since 1975” as your input instead of the actual year values) The correlation coefficient, represented by r, indicates how close to a line the data is. Values close to zero indicate the data is not linear at all. Values close to 1 indicate the data is very linear, and increasing. Values close to –1 indicate the data is very linear, and decreasing. 2) What was the correlation coefficient for this data? Is the data strongly linear, somewhat linear, or not linear? Is the function increasing or decreasing? Interpolation is using the regression equation to predict a value within the boundaries of the given data. 3) Use the regression equation to predict the life expectancy of an American born in 1982. Extrapolation is using the regression equation to predict a value outside the boundaries of the given data. This can be unreliable, since we don’t know if the trend will continue. 4) Use the regression equation to predict the life expectancy of an American born in 2020.
