Fall 2012
advertisement
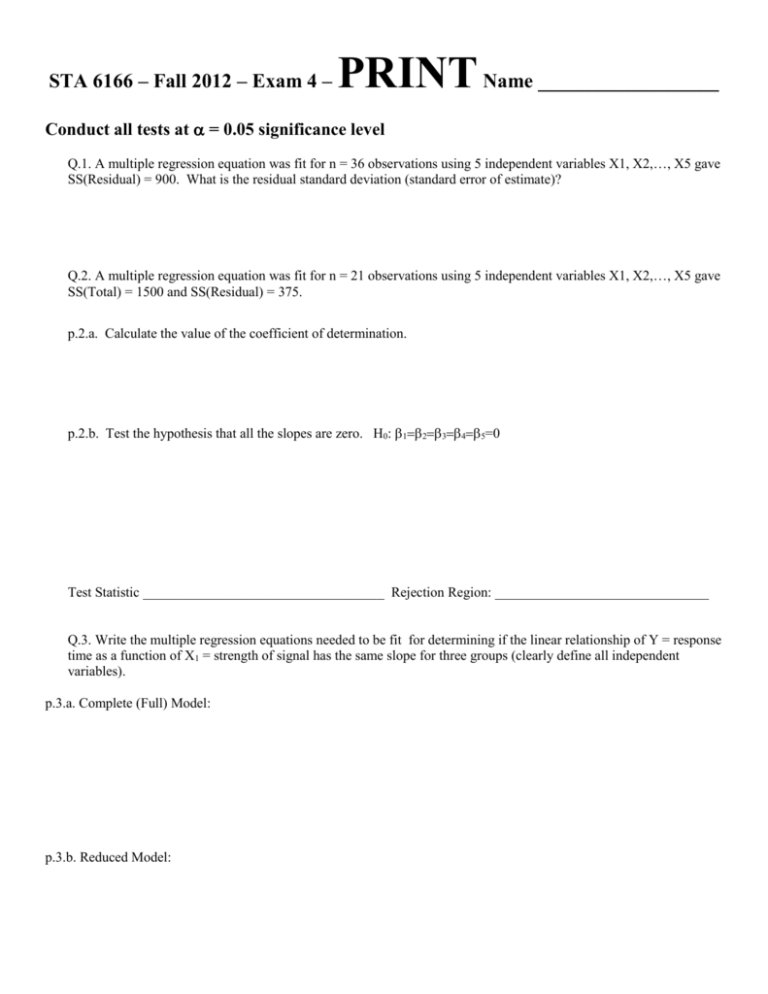
STA 6166 – Fall 2012 – Exam 4 – PRINT Name __________________ Conduct all tests at = 0.05 significance level Q.1. A multiple regression equation was fit for n = 36 observations using 5 independent variables X1, X2,, X5 gave SS(Residual) = 900. What is the residual standard deviation (standard error of estimate)? Q.2. A multiple regression equation was fit for n = 21 observations using 5 independent variables X1, X2,, X5 gave SS(Total) = 1500 and SS(Residual) = 375. p.2.a. Calculate the value of the coefficient of determination. p.2.b. Test the hypothesis that all the slopes are zero. H0: =0 Test Statistic ___________________________________ Rejection Region: _______________________________ Q.3. Write the multiple regression equations needed to be fit for determining if the linear relationship of Y = response time as a function of X1 = strength of signal has the same slope for three groups (clearly define all independent variables). p.3.a. Complete (Full) Model: p.3.b. Reduced Model: Q.4. The ANOVA tables for fitting Y as a linear function of X are shown below. In the first table the “independent variables” include X1, the continuous variable, X2, X3, and X4 as dummy variables to denote the four groups, and X12, X13, and X14 representing the crossproducts of X1 and the dummy variables. The second table is the ANOVA table for fitting Y as a linear function of X1, X2, X3, and X4. Model:(X1,X2,X3,X4,X12,X13,X14) Source df SS Regression 28000 Error Total 19 35000 Model:(X1,X2,X3,X4) Source df Regression Error Total 19 SS 21000 35000 p.4.a. Complete the tables. p.4.b. For the second model, test H0 = 0 Test Statistic _______________________________ Rejection Region ______________________________________ p.4.b. Is there significant evidence the slopes are not equal among the 4 groups? H0: _____________________________________________ Test Statistic _______________________________ Rejection Region ______________________________________ Q.5. The medical records for a sample of patients in a local retirement center were analyzed to determine if there was a relationship between an individual’s blood pressure and the probability of the individual having problems with his/her circulation system. Fitting a logistic regression equation using X = blood pressure and Y = 1 if the individual had problems with his/her circulation system gave as estimates Parameter DF Estimate Intercept 1 -7.4374 x 1 0.0455 Estimate the probability that an individual with blood pressure = 135 will have problems with his/her circulation system. ^ Q.6. You obtain the following spreadsheet from a regression model. The fitted equation is Y 4.67 4.00 X the F-test for Lack-of-Fit. n = ______________ c = _______________ X 2 2 4 4 6 6 Source Lack-of-Fit Pure Error Y 3 5 8 12 18 22 df Ybar_grp Y-hat_grp Pure Error SS MS F Conduct Lack of Fit F(0.05) Q.7. A logistic regression model is fit, relating whether a soldier died during the civil war (Y=1 if he died, 0 if not) to two independent variables: rank (X1=1 if private, 0 if of higher rank) and duty (X2=1 if infantry, 0 if not). Consider the following models for log(: log( Fitted equation -2 log L -2.15 2868.6 X1 -2.58+0.46X1 2862.9 X1+2X2 -3.28+0.50X1+0.87X2 2812.3 p.6.a. Test whether the probability of death is associated with either rank or duty at the =0.05 significance level. Null hypothesis: Alternative hypothesis: Test Statistic _________________________ Rejection Region: _______________________________ p.6.b. Give the fitted values (in terms of probabilities) for each of the following two categories (based on the full model): Private/Infantry: Nonprivate/Noninfantry:
