docx - MIT Haystack Observatory
advertisement
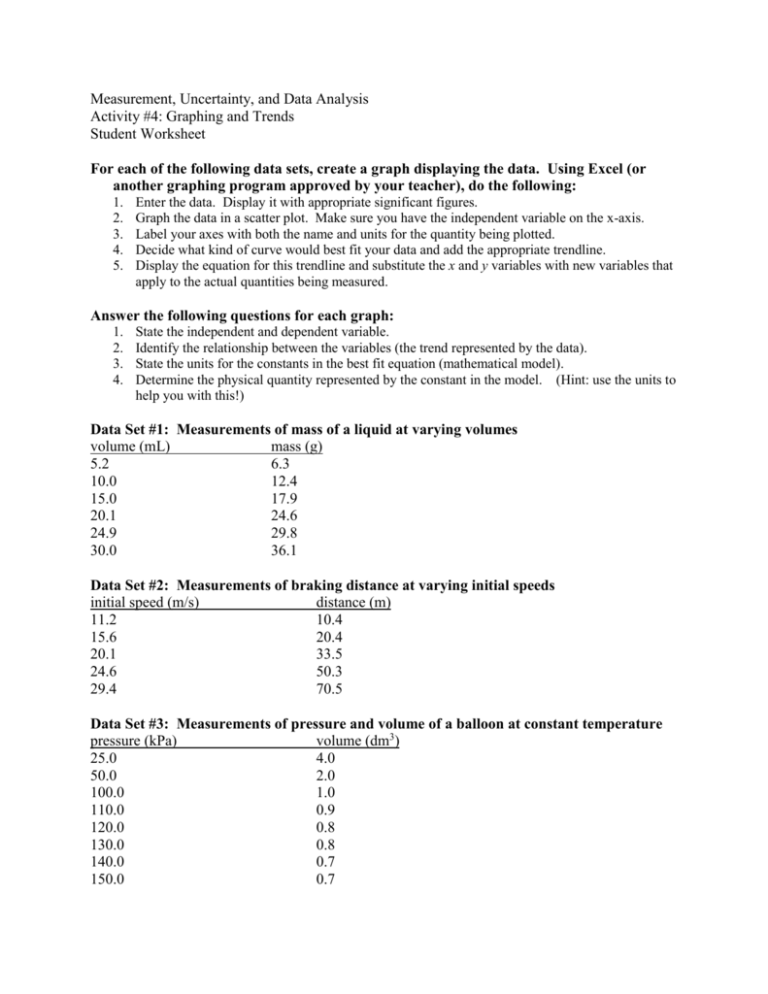
Measurement, Uncertainty, and Data Analysis Activity #4: Graphing and Trends Student Worksheet For each of the following data sets, create a graph displaying the data. Using Excel (or another graphing program approved by your teacher), do the following: 1. 2. 3. 4. 5. Enter the data. Display it with appropriate significant figures. Graph the data in a scatter plot. Make sure you have the independent variable on the x-axis. Label your axes with both the name and units for the quantity being plotted. Decide what kind of curve would best fit your data and add the appropriate trendline. Display the equation for this trendline and substitute the x and y variables with new variables that apply to the actual quantities being measured. Answer the following questions for each graph: 1. 2. 3. 4. State the independent and dependent variable. Identify the relationship between the variables (the trend represented by the data). State the units for the constants in the best fit equation (mathematical model). Determine the physical quantity represented by the constant in the model. (Hint: use the units to help you with this!) Data Set #1: Measurements of mass of a liquid at varying volumes volume (mL) mass (g) 5.2 6.3 10.0 12.4 15.0 17.9 20.1 24.6 24.9 29.8 30.0 36.1 Data Set #2: Measurements of braking distance at varying initial speeds initial speed (m/s) distance (m) 11.2 10.4 15.6 20.4 20.1 33.5 24.6 50.3 29.4 70.5 Data Set #3: Measurements of pressure and volume of a balloon at constant temperature pressure (kPa) volume (dm3) 25.0 4.0 50.0 2.0 100.0 1.0 110.0 0.9 120.0 0.8 130.0 0.8 140.0 0.7 150.0 0.7 Data Set #4: Measurements of radioactivity at increasing distances emanating from a single radioactive source Radioactivity (Bq) Distance (m) 198 0.5 51 1.0 22 1.5 12 2.0 8 2.5 5 3.0. Measurement, Uncertainty, and Data Analysis Activity #4: Graphing and Trends Notes for Teachers and Sample Results The objective of this activity is to give students a chance to practice graphing data and fitting trendlines. Also, it is meant to give them some practice identifying the physical meaning of the parts of the a trendline’s equation. The equations will not fit exactly to the expected form, so students will need to learn what a quadratic looks like when fit as a power function. Data Set #1: Measurements of mass of a liquid at varying volumes volume (mL) mass (g) 5.2 6.3 10.0 12.4 15.0 17.9 20.1 24.6 24.9 29.8 30.0 36.1 1. 2. 3. 4. 5. Enter the data. Display it with appropriate significant figures. Graph the data in a scatter plot. Make sure you have the independent variable on the x-axis. Label your axes, including both the name and units of the quantity being plotted. Decide what kind of curve would best fit your data and add the appropriate trendline. Display the equation for this trendline and substitute the x and y variables with new variables that apply to the actual quantities being measured. Mass (g) Data Set #1: Mass and Volume 40 35 30 25 20 15 10 5 0 M = 1.1963V + 0.2088 R² = 0.9995 0 5 10 15 20 25 30 35 Volume (mL) Answer the following questions for each graph: 1. State the independent and dependent variable. a. Independent = Volume, Dependent = Mass 2. Identify the relationship between the variables (the trend represented by the data). a. Direct Relationship 3. State the units for the constants in the best fit equation (mathematical model). a. The slope = g/mL 4. Determine the physical quantity represented by the constant in the model. (Hint: use the units to help you with this!) a. Density! Data Set #2: Measurements of braking distance at varying initial speeds initial speed (m/s) distance (m) 11.2 10.4 15.6 20.4 20.1 33.5 24.6 50.3 29.4 70.5 1. 2. 3. 4. 5. Enter the data. Display it with appropriate significant figures. Graph the data in a scatter plot. Make sure you have the independent variable on the x-axis. Label your axes with both the name and units for the quantity being plotted. Decide what kind of curve would best fit your data and add the appropriate trendline. Display the equation for this trendline and substitute the x and y variables with new variables that apply to the actual quantities being measured. Data Set #2: Braking Distances 80 70 Distance (m) 60 50 d = 0.0866v1.9851 R² = 0.9999 40 30 20 10 0 0 5 10 15 20 25 30 35 Initial Speed (m/s) Answer the following questions for each graph: 1. State the independent and dependent variable. a. Independent = initial speed, Depedent = distance 2. Identify the relationship between the variables (the trend represented by the data). a. Quadratic 3. State the units for the constants in the best fit equation (mathematical model). a. Constant = s2/m 4. Determine the physical quantity represented by the constant in the model. (Hint: use the units to help you with this!) a. Something like an inverse of acceleration; will be a constant dependent on the force applied by the brakes and the mass of the car. (specifically, mass/Force) Data Set #3: Measurements of pressure and volume of a balloon at constant temperature pressure (kPa) volume (dm3) 25.0 4.0 50.0 2.0 100.0 1.0 110.0 0.9 120.0 0.8 130.0 0.8 140.0 0.7 150.0 0.7 1. 2. 3. 4. 5. Enter the data. Display it with appropriate significant figures. Graph the data in a scatter plot. Make sure you have the independent variable on the x-axis. Label your axes with both the name and units for the quantity being plotted. Decide what kind of curve would best fit your data and add the appropriate trendline. Display the equation for this trendline and substitute the x and y variables with new variables that apply to the actual quantities being measured. Volume (dm3) Data Set #3: Pressure and Volume 4.5 4.0 3.5 3.0 2.5 2.0 1.5 1.0 0.5 0.0 V = 97.492P-0.994 R² = 0.9978 0 20 40 60 80 100 120 140 160 Pressure (kPa) Answer the following questions for each graph: 1. State the independent and dependent variable. a. Independent = pressure, dependent = volume 2. Identify the relationship between the variables (the trend represented by the data). a. Indirect 3. State the units for the constants in the best fit equation (mathematical model). a. kPa*dm3 4. Determine the physical quantity represented by the constant in the model. (Hint: use the units to help you with this!) a. By comparison with the ideal gas law, PV = nRT, the constant is proportional to nRT, and would equal it if we converted volume to m3 and pressure to Pa. Data Set #4: Measurements of radioactivity at increasing distances emanating from a single radioactive source Radioactivity (Bq) Distance (m) 198 0.5 51 1.0 22 1.5 12 2.0 8 2.5 5 3.0 1. 2. 3. 4. 5. Enter the data. Display it with appropriate significant figures. Graph the data in a scatter plot. Make sure you have the independent variable on the x-axis. Label your axes with both the name and units for the quantity being plotted. Decide what kind of curve would best fit your data and add the appropriate trendline. Display the equation for this trendline and substitute the x and y variables with new variables that apply to the actual quantities being measured. Data Set #4: Radioactivity Radioactivity (Bq) 250 200 150 R = 49.535d-2.037 R² = 0.9993 100 50 0 0 0.5 1 1.5 2 2.5 3 3.5 Distance (m) Answer the following questions for each graph: 1. State the independent and dependent variable. a. Independent variable = distance, dependent variable = radioactivity 2. Identify the relationship between the variables (the trend represented by the data). a. Inverse Square 3. State the units for the constants in the best fit equation (mathematical model). a. 49.535 is in Bq*m2. 4. Determine the physical quantity represented by the constant in the model. (Hint: use the units to help you with this!) a. This will be a property of the emitting source, related to its half life.
