CP Chemistry Lab: Using Charles' Law to Determine Absolute Zero
advertisement
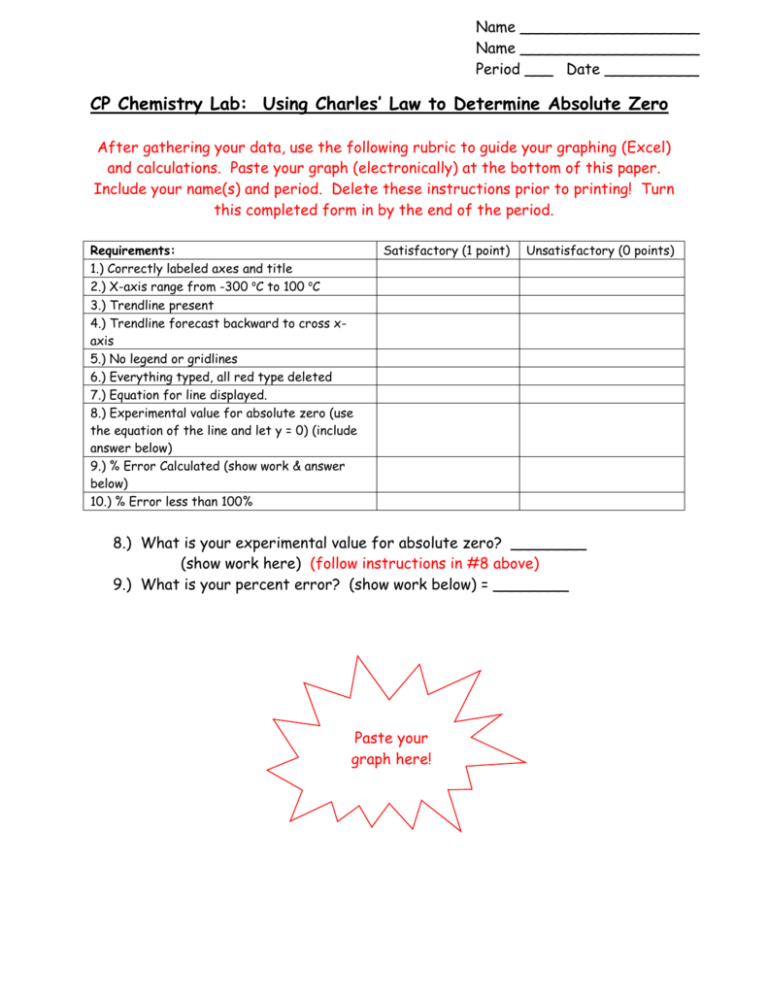
Name ___________________ Name ___________________ Period ___ Date __________ CP Chemistry Lab: Using Charles’ Law to Determine Absolute Zero After gathering your data, use the following rubric to guide your graphing (Excel) and calculations. Paste your graph (electronically) at the bottom of this paper. Include your name(s) and period. Delete these instructions prior to printing! Turn this completed form in by the end of the period. Requirements: 1.) Correctly labeled axes and title 2.) X-axis range from -300 oC to 100 oC 3.) Trendline present 4.) Trendline forecast backward to cross xaxis 5.) No legend or gridlines 6.) Everything typed, all red type deleted 7.) Equation for line displayed. 8.) Experimental value for absolute zero (use the equation of the line and let y = 0) (include answer below) 9.) % Error Calculated (show work & answer below) 10.) % Error less than 100% Satisfactory (1 point) Unsatisfactory (0 points) 8.) What is your experimental value for absolute zero? ________ (show work here) (follow instructions in #8 above) 9.) What is your percent error? (show work below) = ________ Paste your graph here!
