UV-Vis & Fluorescence
advertisement
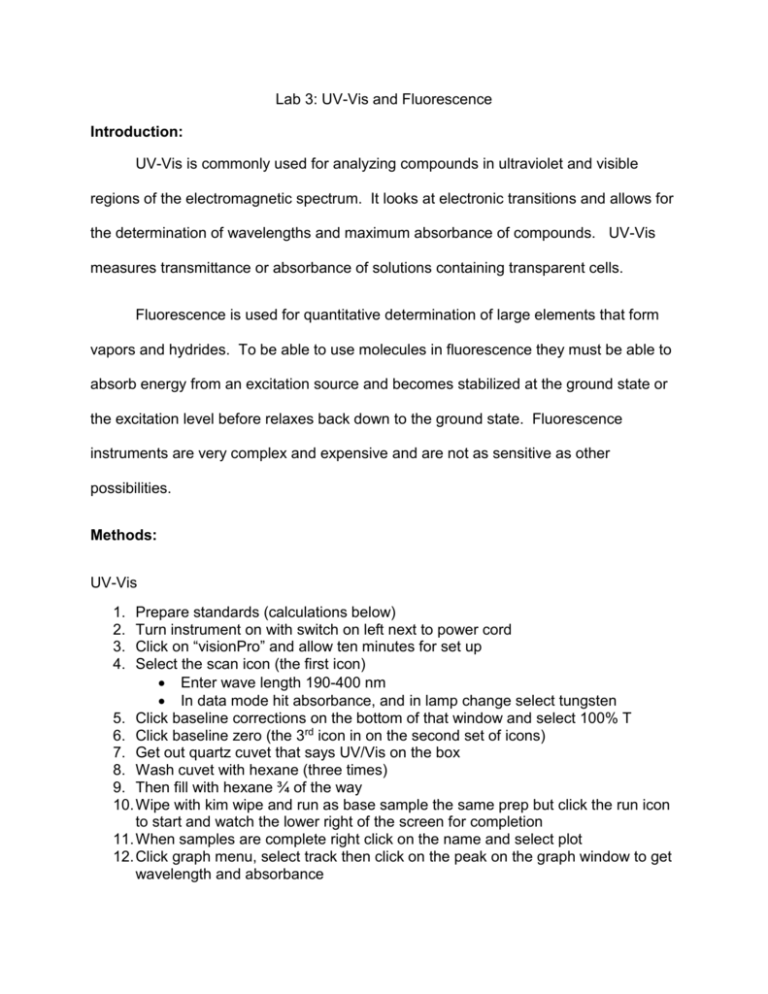
Lab 3: UV-Vis and Fluorescence Introduction: UV-Vis is commonly used for analyzing compounds in ultraviolet and visible regions of the electromagnetic spectrum. It looks at electronic transitions and allows for the determination of wavelengths and maximum absorbance of compounds. UV-Vis measures transmittance or absorbance of solutions containing transparent cells. Fluorescence is used for quantitative determination of large elements that form vapors and hydrides. To be able to use molecules in fluorescence they must be able to absorb energy from an excitation source and becomes stabilized at the ground state or the excitation level before relaxes back down to the ground state. Fluorescence instruments are very complex and expensive and are not as sensitive as other possibilities. Methods: UV-Vis 1. 2. 3. 4. Prepare standards (calculations below) Turn instrument on with switch on left next to power cord Click on “visionPro” and allow ten minutes for set up Select the scan icon (the first icon) Enter wave length 190-400 nm In data mode hit absorbance, and in lamp change select tungsten 5. Click baseline corrections on the bottom of that window and select 100% T 6. Click baseline zero (the 3rd icon in on the second set of icons) 7. Get out quartz cuvet that says UV/Vis on the box 8. Wash cuvet with hexane (three times) 9. Then fill with hexane ¾ of the way 10. Wipe with kim wipe and run as base sample the same prep but click the run icon to start and watch the lower right of the screen for completion 11. When samples are complete right click on the name and select plot 12. Click graph menu, select track then click on the peak on the graph window to get wavelength and absorbance Fluorescence 1. Prepare sample again and make a random sample 2. Open PX-150X program 3. Click configure select PC configuration, port 1 Configure, instrument, on 4. Click aquire in mode and spectrum 5. Click configure and parameters Spectrum type: excitation EM wavelength: 400 nm EX wavelength range: 200-900 nm Sensitivity: low Scan speed: fast Recording range: -10 to 500 EX/EM slit width: 10/10 Response time: 0.02 6. Click run 7. Click the lambda after the first run and set the ranges to EX: 230-450 nm EM: 240-650 nm 8. Search and then write down the optimal wavelengths EX was 343 EM was 448 9. Select configure and parameters 10. Switch the spectrum to emission Put the excision wavelength as the one we found Make sure the emission range has the value found in it 11. Run other samples and note peaks (intensity) and wavelengths Calculations: UV-Vis 1 𝑚𝑔 0.001 𝑔 1𝑔 100 𝑚𝑔 = = = 1𝑔 1,000,000 𝑔 100 𝑚𝐿 1000𝑚𝐿(1 𝑚𝐿) 1000 𝑔 M1V1=M2V2 1000(x)=(40)(50) = 1000(x)=2000 =2.0mL 1000(x)=(25)(50) = 1000(x)=1250 =1.25 mL 1000(x)=(10)(50) = 1000(x)=500 =0.5 mL 1000(x)=(7)(50) = 1000(x)=350 =0.35 mL 1000(x)=(2)(50) = 1000(x)=100 =0.10 mL All at wavelength of 310 nm 2 ppm absorbance= 0.017 7 ppm absorbance= 0.044 10 ppm absorbance= 0.025 25 ppm absorbance= 0.267 40 ppm absorbance= 0.459 Unknown ppm absorbance= 0.335 Unknown ppm calculation 0.335 = 0.01190𝑥 − 0.0234 0.3584 = 0.01190𝑥 30.12 = 𝑥 30.12 𝑝𝑝𝑚 Fluorescence 1 𝑚𝑔 0.001 𝑔 1𝑔 100 𝑚𝑔 = = = 1𝑔 1,000,000 𝑔 100 𝑚𝐿 1000𝑚𝐿(1 𝑚𝐿) 1000 𝑔 M1V1=M2V2 1000(x)=(3.5)(50) 1000(x)=(3)(50) = = 1000(x)=(2.5)(50) 1000(x)=(2)(50) 1000(x)=150 = = 1000(x)=175 1000(x)=125 1000(x)=100 =0.175mL =0.15 mL =0.125 mL =0.1 mL All wavelengths at 447.872 nm 2 ppm intensity= 492.44 2.5 ppm intensity= 634.074 3 ppm intensity= 772.00 3.5 ppm intensity= 850. 593 Tonic water intensity= 538.148 Tonic water ppm calculation 538.148 = 242.2𝑥 + 21.09 517.058 = 242.2𝑥 2.135 = 𝑥 2.135 𝑝𝑝𝑚 Results: VisonPro software print outs for the UV-Vis can be found on pages 58-68 of the lab notebook. The concentration curves and R2 values calculated are located on page 70. The fluorescence instrument did not have a print our capability but the intensitys and wavelengths can be found on pages 45-47 along with the rest of the write up. The concentration curve and R2 value calculated can be found on page 71. Discussion: As seen on page 70 of the lab notebook, there are two different concentration curves. The 10 ppm seemed to be an outliar so it was removed to raise the R2 value and give a better equation of the line. The equation was used in the calculation of the unknown’s ppm value. Pages 57 through 62 are the original readings with three peaks. Amanda assisted us and said that we should rerun them with a smaller wavelength range that we were looking for (single it down to one peak). The wave length for the second set of data was changed to 280-340 nm. We had a lot of difficulty using the fluorescence instrument. Originally we used a 5 and 4 ppm value also. These both flat lined and were not good data so they were removed. Overall these experiments seemed to be for the most part successful. We got good results and good R2 values.
