Factors Affecting Enzyme Activity Assignment
advertisement
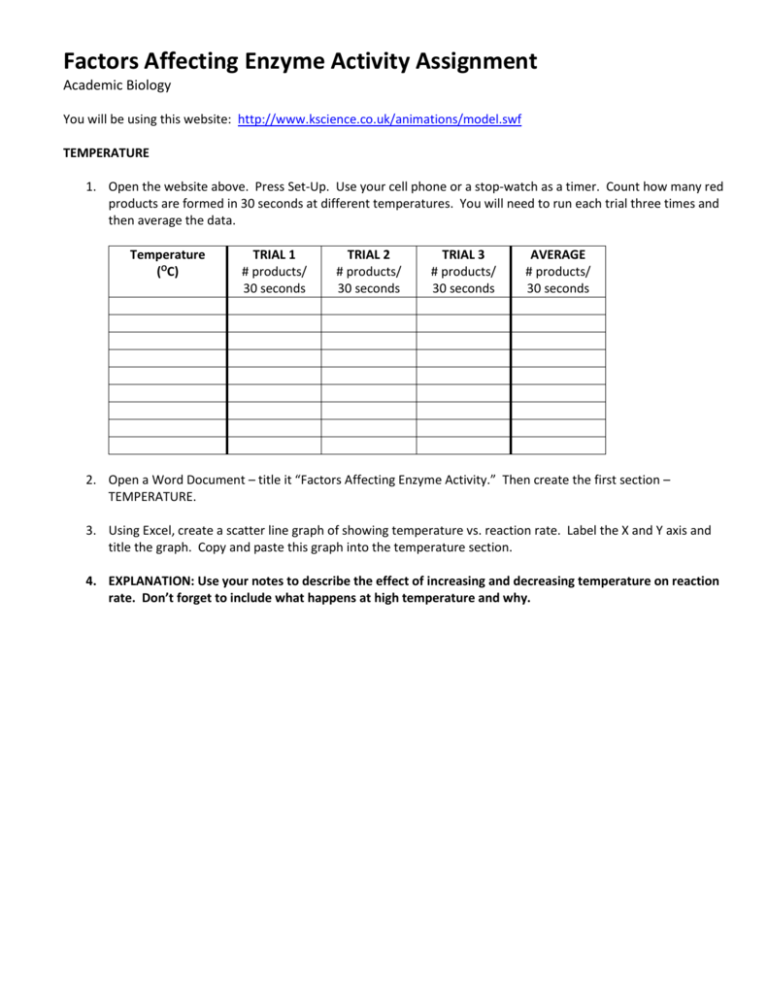
Factors Affecting Enzyme Activity Assignment Academic Biology You will be using this website: http://www.kscience.co.uk/animations/model.swf TEMPERATURE 1. Open the website above. Press Set-Up. Use your cell phone or a stop-watch as a timer. Count how many red products are formed in 30 seconds at different temperatures. You will need to run each trial three times and then average the data. Temperature (OC) TRIAL 1 # products/ 30 seconds TRIAL 2 # products/ 30 seconds TRIAL 3 # products/ 30 seconds AVERAGE # products/ 30 seconds 2. Open a Word Document – title it “Factors Affecting Enzyme Activity.” Then create the first section – TEMPERATURE. 3. Using Excel, create a scatter line graph of showing temperature vs. reaction rate. Label the X and Y axis and title the graph. Copy and paste this graph into the temperature section. 4. EXPLANATION: Use your notes to describe the effect of increasing and decreasing temperature on reaction rate. Don’t forget to include what happens at high temperature and why. pH LEVEL 1. Return the temperature to 25 degrees Celcius. Count how many red products are formed in 30 seconds at different pH levels. You will need to run each trial three times and then average the data. pH TRIAL 1 # products/ 30 seconds TRIAL 2 # products/ 30 seconds TRIAL 3 # products/ 30 seconds AVERAGE # products/ 30 seconds 2. Using Excel, create a scatter line graph of showing pH vs. reaction rate. Label the X and Y axis and title the graph. Copy and paste this graph into the pH section. 3. EXPLANATION: Use your notes to describe the effect of increasing and decreasing pH on reaction rate. Explain why. ENZYME CONCENTRATION 1. Return the temperature to 25 degrees Celcius and pH back to where it started. Count how many red products are formed in 30 seconds at different enzyme levels. You will need to run each trial three times and then average the data. enzyme # TRIAL 1 # products/ 30 seconds TRIAL 2 # products/ 30 seconds TRIAL 3 # products/ 30 seconds AVERAGE # products/ 30 seconds 2. Using Excel, create a scatter line graph of showing enzyme concentration vs. reaction rate. Label the X and Y axis and title the graph. Copy and paste this graph into the enzyme concentration section. 3. EXPLANATION: Use your notes to describe the effect of increasing and decreasing enzyme concentration on reaction rate. Explain why. SUBSTRATE CONCENTRATION 1. Reset all variables. Count how many red products are formed in 30 seconds at different substrate levels. You will need to run each trial three times and then average the data. substrate # TRIAL 1 # products/ 30 seconds TRIAL 2 # products/ 30 seconds TRIAL 3 # products/ 30 seconds AVERAGE # products/ 30 seconds 2. Using Excel, create a scatter line graph of showing substrate concentration vs. reaction rate. Label the X and Y axis and title the graph. Copy and paste this graph into the substrate concentration section. 3. EXPLANATION: Use your notes to describe the effect of increasing and decreasing substrate concentration on reaction rate. Explain why. BONUS What combination of factors (pH, temperature, enzyme and substrate concentrations) produced the highest reaction rate? Support your statement with data showing that this is the best combination.

