Name: Date: Period: Independent Practice: Periodic Trends [Atomic
advertisement
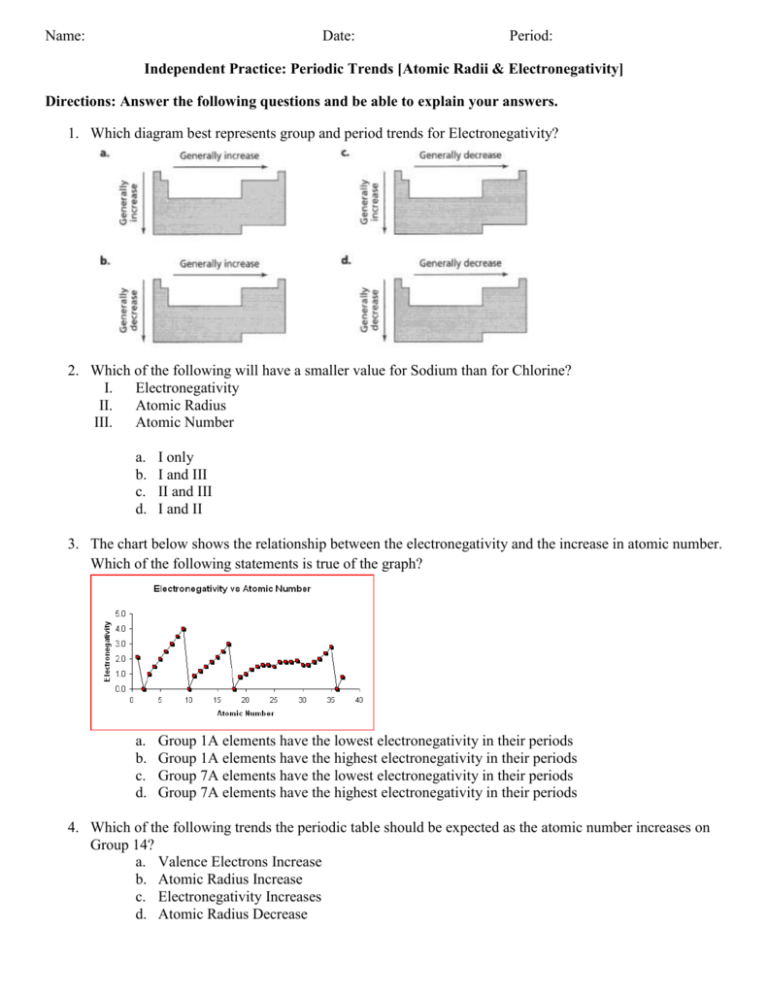
Name: Date: Period: Independent Practice: Periodic Trends [Atomic Radii & Electronegativity] Directions: Answer the following questions and be able to explain your answers. 1. Which diagram best represents group and period trends for Electronegativity? 2. Which of the following will have a smaller value for Sodium than for Chlorine? I. Electronegativity II. Atomic Radius III. Atomic Number a. b. c. d. I only I and III II and III I and II 3. The chart below shows the relationship between the electronegativity and the increase in atomic number. Which of the following statements is true of the graph? a. b. c. d. Group 1A elements have the lowest electronegativity in their periods Group 1A elements have the highest electronegativity in their periods Group 7A elements have the lowest electronegativity in their periods Group 7A elements have the highest electronegativity in their periods 4. Which of the following trends the periodic table should be expected as the atomic number increases on Group 14? a. Valence Electrons Increase b. Atomic Radius Increase c. Electronegativity Increases d. Atomic Radius Decrease 5. Which of the following properties decreases from left to right across a period? a. Atomic Number b. Electronegativity c. Atomic Radii d. Number of Electrons 6. Which element listed below has the largest atomic radii? a. Iodine b. Silver c. Strontium d. Tin 7. Which element attracts electrons the most strongly (the highest electronegativity)? a. Phosphorus b. Bismuth c. Nitrogen d. Antimony 8. Which diagram best represents group and period trends for atomic radii?
