Statistics Review: Biased Samples & Data Analysis
advertisement
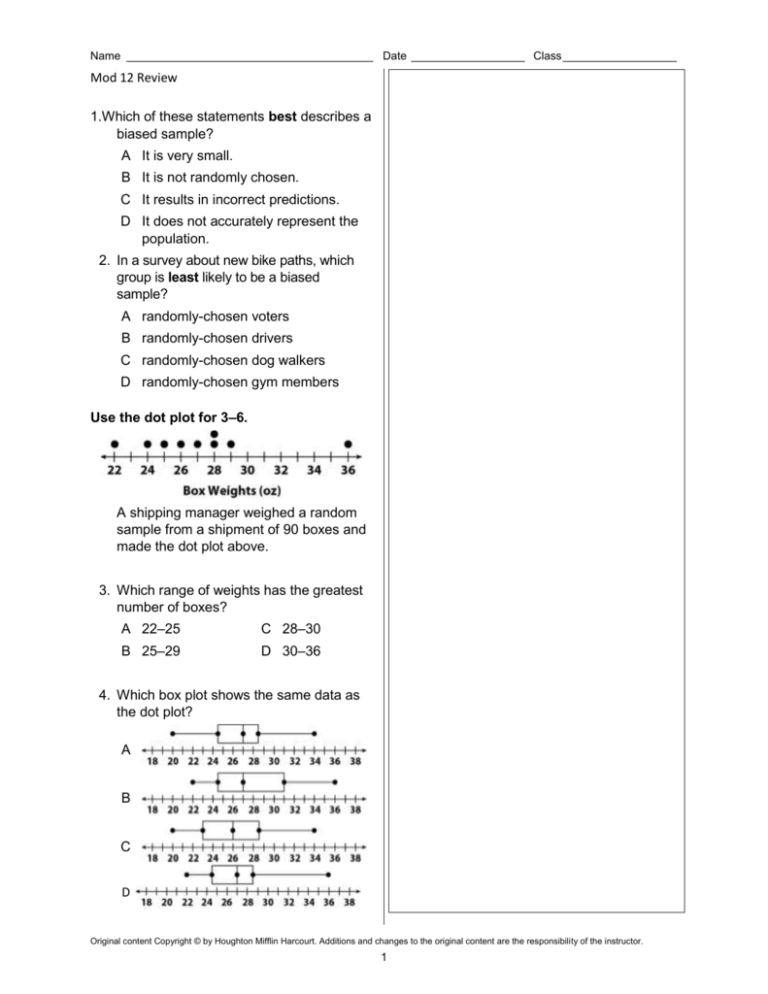
Name _______________________________________ Date __________________ Class __________________ Mod 12 Review 1.Which of these statements best describes a biased sample? A It is very small. B It is not randomly chosen. C It results in incorrect predictions. D It does not accurately represent the population. 2. In a survey about new bike paths, which group is least likely to be a biased sample? A randomly-chosen voters B randomly-chosen drivers C randomly-chosen dog walkers D randomly-chosen gym members Use the dot plot for 3–6. A shipping manager weighed a random sample from a shipment of 90 boxes and made the dot plot above. 3. Which range of weights has the greatest number of boxes? A 22–25 C 28–30 B 25–29 D 30–36 4. Which box plot shows the same data as the dot plot? A B C D Original content Copyright © by Houghton Mifflin Harcourt. Additions and changes to the original content are the responsibility of the instructor. 1 Name _______________________________________ Date __________________ Class __________________ 5.Use the data to estimate the weight of all 90 boxes. A 2,000 oz C 3,000 oz B 2,500 oz D 3,500 oz 6. Which of these values is much easier to see on the box plot than on the dot plot? A range B interquartile range C minimum D maximum 7. A town has about 35,000 registered voters. A random sample of 500 people finds that 125 are in favor of a new dog park. How many people are likely to vote for the dog park? A 25 C 2,625 B 125 D 8,750 Use the data sets for 8 and 9. Plant Heights (cm): Group 1 28, 28, 30, 35, 29, 23, 25, 38, 40, 30, 26, 20 Plant Heights (cm): Group 2 20, 22, 30, 25, 15, 20, 25, 45, 28, 40, 40, 20 8. Which is an accurate comparison? A Group 2 has a greater mean and a wider distribution of heights. B Group 2 has a greater mean and a narrower distribution of heights. C Group 2 has a lesser mean and a wider distribution of heights. D Group 2 has a lesser mean and a narrower distribution of heights. 9. Which compares the tallest plant in Group 2 to the tallest plant in Group 1? A 11.1% shorter C 11.1% taller B 12.5% shorter D 12.5% taller Original content Copyright © by Houghton Mifflin Harcourt. Additions and changes to the original content are the responsibility of the instructor. 2 Name ________________________________________ Date __________________ Class __________________ 10. A principal wants to find out if her school needs more bike racks. A survey is taken of 30 students who ride the bus. Why might the sample be biased? Describe a sample that is more representative of the entire school. _______________________________________ _______________________________________ _______________________________________ Use the data set for 11–15. Children’s Ages 7, 4, 7, 7, 2, 10, 12, 8, 7, 4 The data set shows the ages of a random sample of children under 14 who live in an apartment building. 11. Make a dot plot to display the data. 12. Make a box plot to display the data. 13. What is the range and the most common age? _______________________________________ 14. What is the median age? _______________________________________ 15. Is a child in this building whose age is under 14 more likely to be younger than 7 or older than 7? _______________________________________ Original content Copyright © by Houghton Mifflin Harcourt. Additions and changes to the original content are the responsibility of the instructor. 3 Name ________________________________________ Date __________________ Class __________________ Use the data sets for 16–19. High School Students 24, 45, 5, 12, 18, 20, 41, 33, 17, 25, 30, 15, 21, 37, 40 College Students 25, 6, 16, 24, 32, 5, 10, 8, 28, 45, 8, 36, 28, 22, 8 Random samples were taken of two groups. Students were asked how many movies they rented last year. 16. Make two box plots to display the data. 17. Compare the ranges, interquartile ranges, and medians. _______________________________________ _______________________________________ _______________________________________ 18. What can you infer about the populations from these samples? _______________________________________ _______________________________________ 19. The surveyors decide to increase the sample sizes by 60%. How many students will be in the new survey? _______________________________________ Original content Copyright © by Houghton Mifflin Harcourt. Additions and changes to the original content are the responsibility of the instructor. 4
