Sampling stuff - Senior Secondary
advertisement
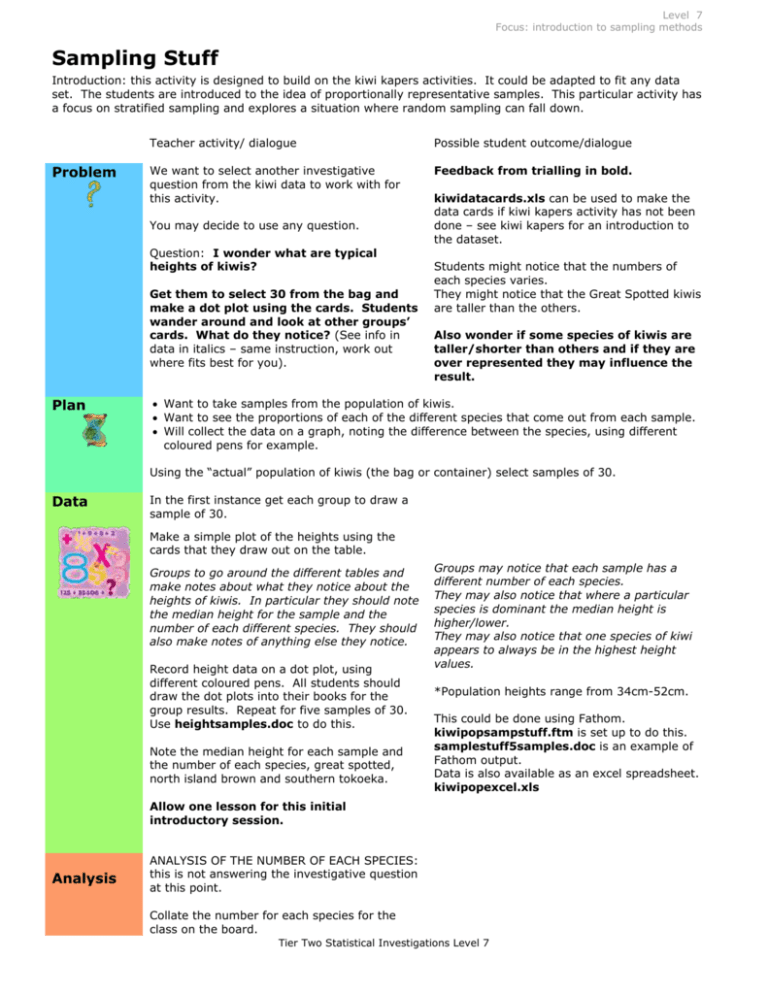
Level 7 Focus: introduction to sampling methods Sampling Stuff Introduction: this activity is designed to build on the kiwi kapers activities. It could be adapted to fit any data set. The students are introduced to the idea of proportionally representative samples. This particular activity has a focus on stratified sampling and explores a situation where random sampling can fall down. Problem Teacher activity/ dialogue Possible student outcome/dialogue We want to select another investigative question from the kiwi data to work with for this activity. Feedback from trialling in bold. You may decide to use any question. Question: I wonder what are typical heights of kiwis? Get them to select 30 from the bag and make a dot plot using the cards. Students wander around and look at other groups’ cards. What do they notice? (See info in data in italics – same instruction, work out where fits best for you). Plan kiwidatacards.xls can be used to make the data cards if kiwi kapers activity has not been done – see kiwi kapers for an introduction to the dataset. Students might notice that the numbers of each species varies. They might notice that the Great Spotted kiwis are taller than the others. Also wonder if some species of kiwis are taller/shorter than others and if they are over represented they may influence the result. Want to take samples from the population of kiwis. Want to see the proportions of each of the different species that come out from each sample. Will collect the data on a graph, noting the difference between the species, using different coloured pens for example. Using the “actual” population of kiwis (the bag or container) select samples of 30. Data In the first instance get each group to draw a sample of 30. Make a simple plot of the heights using the cards that they draw out on the table. Groups to go around the different tables and make notes about what they notice about the heights of kiwis. In particular they should note the median height for the sample and the number of each different species. They should also make notes of anything else they notice. Record height data on a dot plot, using different coloured pens. All students should draw the dot plots into their books for the group results. Repeat for five samples of 30. Use heightsamples.doc to do this. Note the median height for each sample and the number of each species, great spotted, north island brown and southern tokoeka. Groups may notice that each sample has a different number of each species. They may also notice that where a particular species is dominant the median height is higher/lower. They may also notice that one species of kiwi appears to always be in the highest height values. *Population heights range from 34cm-52cm. This could be done using Fathom. kiwipopsampstuff.ftm is set up to do this. samplestuff5samples.doc is an example of Fathom output. Data is also available as an excel spreadsheet. kiwipopexcel.xls Allow one lesson for this initial introductory session. Analysis ANALYSIS OF THE NUMBER OF EACH SPECIES: this is not answering the investigative question at this point. Collate the number for each species for the class on the board. Tier Two Statistical Investigations Level 7 What do they notice? Students should notice that the numbers for each of the species varies quite a bit. So simply drawing names out of a hat doesn’t necessarily give an proportional representation. Using kiwipopsample5.ftm make multiple random samples. The file is set up to take 100 samples and record the number of each species in graphs. Click on collect more measures. Fathom takes many samples quickly, from this we can see that random sampling doesn’t necessarily give a sample with the same proportions of each species as in the population. A simple dot plot for each species would work. Groups to add their five count results to each plot. Problem Why do we want to take a proportionally representative sample? How do we do this? Plan From the data collected from their 100 samples the students worked out a range for the number of each species in a sample of 30. They then came up with what was typical. From here the students looked in their table of 100 samples (measures from sample of kiwipop) to see how often this particular breakdown of the species happened. Measures from Sample of Kiwipop countGS countNIBr countT ok 1 10 11 9 2 9 11 10 3 4 13 13 4 4 14 12 5 6 12 12 6 12 11 7 7 5 9 16 8 7 10 13 9 5 10 15 10 7 11 12 11 9 11 10 12 10 11 9 13 6 16 8 14 9 6 15 15 12 8 10 16 6 18 6 <new> From here we went to back to kiwipopsampstuff.ftm. Students then clicked on the sample more cases button to see what was happening. This is in effect simulating what they did the day before when they were taking their samples from the bag. What do they notice? Now need to discuss why this might be a problem, what would happen if the number of GS is a lot higher (or lower) than what we would expect? From the class results the range of counts for Great spotted were from 2-14; North Island Brown from 4-18; Great Tokoeka from 4-18. The students decided that the average for the class was 6-8 for GS, 12 for NIBr and 13 for Tok. This gave a total of 33 but they were happy with this. This is a sample of a table from fathom showing the counts. The ones that are closest to what was wanted in this example are: #5 and #10. Obviously with a total of 33 it won’t be exact. If you decide to use fathom in the first lesson, this has already been done, refer them back to their graphs. Hopefully the students notice the GS tend to be to the right, ie taller than the rest, and the number of GS varies greatly. Hopefully they might suggest that if the number of GS is very high or very low this might make a difference to the median (or mean). Tier Two Statistical Investigations Level 7 How could we fix this? Why might it be important to have a proportionally representative sample by species? We need to know how many of each species there are in the population, or the approximate proportion of each species in the population, as the exact number might not be possible to find. Data Need to look at selecting a fair share of each species, so that one species doesn’t unduly influence the overall results. In the population there is: 163 Great Spotted kiwis 275 North Island Brown kiwis 262 Southern Tokoeka kiwis Once we have the proportion of each species in the population we can work out how many of each species to have in the sample so that the proportion of the species in the sample is approximately the same as the proportion of the species in the population. I allowed the students to struggle with this for a while and one of them came up with the idea that we need to work out what fraction each is of the total and then find the percentage each is of the total. Once that was done worked out x% of 30 to find the number of each species in their population. Ideas on how to do this? 23.3%; 39.3%; 37.4% respectively So for a sample of 30 we would need… 7; 12; 11 respectively to make a sample of 30 Once these are calculated you could look back at the Fathom file (kiwipopsample5.ftm) and note where they are on the graphs. Collect a sample of 30 using the appropriate proportions, ie sample 7 from GS, 12 from NIBr and 11 from Tok. The kiwi data cards will need to be sorted into their separate species (colours). Make a box plot for each dot plot. Analysis Compare and contrast the proportional sample with the original sample(s). Answering the question: I wonder what are typical heights of kiwis? Make I notice statements about the graphs and statistics for height. Remember to consider the shape, spread, middle 50%, median, IQR, anything unusual. For each I notice statement about the heights (description of the data) make a statement about the heights in the population (inference to the population). I notice…, this suggests that back in the population… (for situations where sample and population same/similar) Or: I notice…, however back in the population I think… (for situations where sample might differ from population) Conclusion I wonder what are typical heights of kiwis? Answer the question: Provide supporting evidence: Generalise back to the population: Reflection Extension activity What are the advantages and disadvantages of using a proportional sampling method? Investigate strata used by market research companies. Imagine you have your own research company and want to investigate _________ at your school. Plan your investigation, including details of how you will select your sample. Tier Two Statistical Investigations Level 7 Tier Two Statistical Investigations Level 7
