Algebra 1 – Bar Graphs and Dot Plots
advertisement
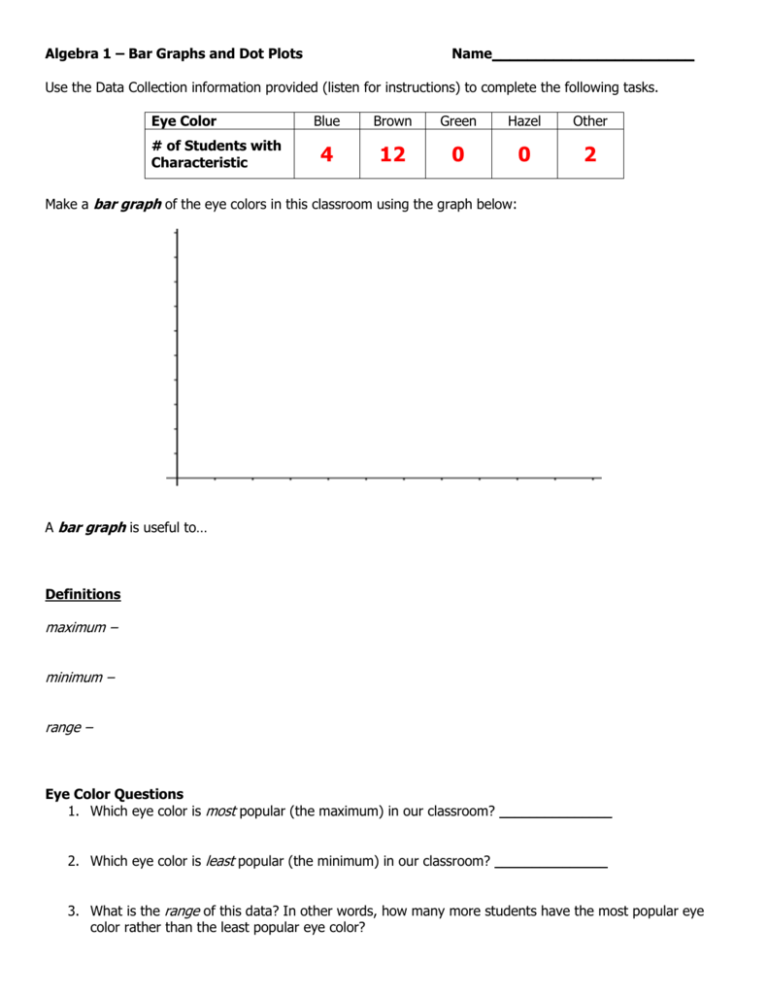
Algebra 1 – Bar Graphs and Dot Plots Name_______________________ Use the Data Collection information provided (listen for instructions) to complete the following tasks. Eye Color # of Students with Characteristic Blue Brown Green Hazel Other 4 12 0 0 2 Make a bar graph of the eye colors in this classroom using the graph below: A bar graph is useful to… Definitions maximum – minimum – range – Eye Color Questions 1. Which eye color is most popular (the maximum) in our classroom? _______________ 2. Which eye color is least popular (the minimum) in our classroom? _______________ 3. What is the range of this data? In other words, how many more students have the most popular eye color rather than the least popular eye color? Algebra 1 – Bar Graphs and Dot Plots, continued Shoe Size 5 6 7 8 9 10 11 12 # of Students with Characteristic 1 1 1 0 5 4 3 1 Make a dot plot of the shoe size comparisons of this classroom using the graph below: A dot plot is useful to… Shoe Size Questions 1. What is the maximum of this data? 2. What is the minimum of this data? 3. What is the range of the given data? Homework Complete each graph on a separate sheet of paper. Then, state the maximum, minimum, and range of the given data. 1. Make a bar graph of the following data (listen for instructions to fill in the table!). Favorite Type of Chewing Gum Stride 5 Gum Any Mint Hubba Bubba Trident Other # of Students with Characteristic 3 4 2 2 2 4 Average Number of Minutes to Complete an Assignment 25 30 35 40 45 50 # of Students with Characteristic 2 4 7 8 6 3 2. Make a dot plot of the following data.


