Electronic Supplementary Material: AFLP datasets were generated
advertisement
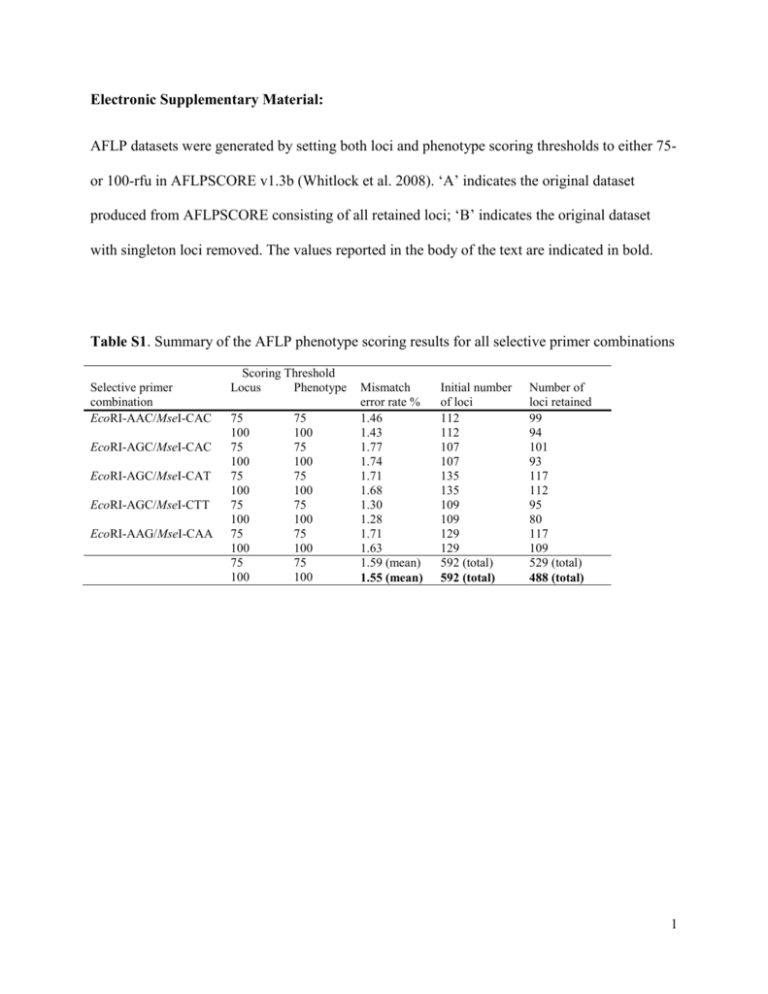
Electronic Supplementary Material: AFLP datasets were generated by setting both loci and phenotype scoring thresholds to either 75or 100-rfu in AFLPSCORE v1.3b (Whitlock et al. 2008). ‘A’ indicates the original dataset produced from AFLPSCORE consisting of all retained loci; ‘B’ indicates the original dataset with singleton loci removed. The values reported in the body of the text are indicated in bold. Table S1. Summary of the AFLP phenotype scoring results for all selective primer combinations Selective primer combination EcoRI-AAC/MseI-CAC EcoRI-AGC/MseI-CAC EcoRI-AGC/MseI-CAT EcoRI-AGC/MseI-CTT EcoRI-AAG/MseI-CAA Scoring Threshold Locus Phenotype 75 100 75 100 75 100 75 100 75 100 75 100 75 100 75 100 75 100 75 100 75 100 75 100 Mismatch error rate % 1.46 1.43 1.77 1.74 1.71 1.68 1.30 1.28 1.71 1.63 1.59 (mean) 1.55 (mean) Initial number of loci 112 112 107 107 135 135 109 109 129 129 592 (total) 592 (total) Number of loci retained 99 94 101 93 117 112 95 80 117 109 529 (total) 488 (total) 1 Table S2. Within sub-population and global genetic diversity for the British Columbia population of Apodemia mormo. Global measures are reported as mean values. All statistical analyses were performed using AFLP-SURV (Vekemans et al. 2002) Site N W1 W2 W3 W4 W5 W6 W7 W8 C1 C2 E1 E2 N1 N2 All 45 39 19 38 44 41 15* 38 38 40 40 29 28 13* 467 75 rfu thresholds A (526 loci) PPL He (±SE) 15.4 0.061 (0.006) 14.4 0.050 (0.005) 14.1 0.044 (0.005) 15.0 0.050 (0.005) 13.5 0.047 (0.005) 14.4 0.044 (0.005) 15.2 0.055 (0.006) 14.4 0.053 (0.005) 14.3 0.047 (0.005) 14.3 0.047 (0.005) 17.1 0.063 (0.006) 15.6 0.061 (0.006) 13.5 0.056 (0.005) 14.6 0.060 (0.006) 14.7 0.053 (0.005) B (380 loci) PPL He (±SE) 21.3 0.083 (0.007) 20.0 0.069 (0.007) 19.5 0.060 (0.007) 20.8 0.069 (0.006) 18.7 0.064 (0.007) 20.0 0.061 (0.006) 21.1 0.075 (0.007) 20.0 0.073 (0.007) 19.7 0.064 (0.006) 19.7 0.064 (0.007) 23.7 0.086 (0.008) 21.6 0.083 (0.007) 18.7 0.077 (0.007) 20.3 0.081 (0.008) 20.4 0.072 (0.007) 100 rfu thresholds A (484 loci) PPL He (±SE) 15.1 0.061 (0.006) 14.9 0.052 (0.005) 14.9 0.046 (0.005) 15.1 0.049 (0.005) 12.2 0.048 (0.005) 12.2 0.046 (0.005) 15.3 0.057 (0.006) 15.5 0.056 (0.006) 14.7 0.048 (0.005) 11.6 0.048 (0.005) 15.9 0.062 (0.006) 15.3 0.062 (0.006) 14.0 0.058 (0.006) 15.3 0.061 (0.006) 14.4 0.054 (0.009) B (326 loci) PPL He (±SE) 22.4 0.088 (0.008) 22.1 0.077 (0.008) 22.1 0.068 (0.008) 22.4 0.072 (0.007) 18.1 0.071 (0.008) 18.1 0.068 (0.007) 22.7 0.083 (0.008) 23.0 0.082 (0.008) 21.8 0.070 (0.007) 17.2 0.070 (0.008) 23.6 0.090 (0.008) 22.7 0.090 (0.008) 20.9 0.085 (0.008) 22.7 0.087 (0.008) 21.4 0.079 (0.008) N, number of analysed samples; PPL, proportion of polymorphic loci; He, expected heterozygosity 2 Table S3. Genetic structure summary for the British Columbian population of Apodemia mormo. All statistical analyses were conducted using AFLP-SURV (Vekemans et al. 2002) 75 100 A B A B Ht 0.055 0.075 0.056 0.082 Hw (±SE) 0.053 (0.002) 0.072 (0.002) 0.054 (0.002) 0.079 (0.002) Hb (±SE) 0.002 (0.0003) 0.003 (0.0003) 0.002 (0.0003) 0.004 (0.0004) FST (±SE) 0.039 (0.113)* 0.039 (0.112)* 0.042 (0.107)* 0.043 (0.105)* Ht, total gene diversity; Hw, average gene diversity within populations; Hb, average gene diversity among populations in excess of that observed within populations; FST, proportion of the total gene diversity that occurs among as opposed to within populations *p < 0.00001 3 Table S4. Robustness of the genetic barriers identified by BARRIER v2.2 (Manni et al. 2004) based on 100 permuted genetic distance matrices (FST). Barriers are listed in order of importance (A, B, C, etc.), and are considered to possess high bootstrap support when bootstrap values are greater than 50 Number of barriers tested for: 1 barrier 2 barriers A B 3 barriers A B C 4 barriers A B C D 5 barriers A B C D E Scoring criteria 75-A 75-76 75-B 72 100-A 74-75 100-B 70-87 91-92 65 91 62 87-89 71 88-91 70 97-99 96 88 95-96 86 92 94-96 92 81 94-97 90 83 98-100 100 96 71 98-99 96 99 74 98-100 100 98 84 97-100 99 100 87 98-100 100 99 90 45 99-100 98 100 90 45 99-100 100 100 97 45 98-100 100 100 96 39-48 Table S5. Summary of the principal coordinate analysis (PCoA) of all studied sub-populations performed in GENALEX v.6.0 (Peakall and Smouse 2006), based on a genetic distance matrix (FST). The amount of variability that is accounted for by the first two coordinates is reported Scoring criteria 75 100 % of variation explained A B A B Coordinate 1 45.26 45.11 45.78 45.59 Coordinate 2 24.47 24.50 23.95 23.95 4 Table S6. Summary of the mantel tests results examining the relationship between genetic differentiation (Fst/ (1-Fst) and geographical distance (ln transformed) among all studied subpopulations (analysis performed using GENALEX v.6.0; Peakall and Smouse 2006). Geographic distance was measured as both straight line distance between sites (Euclidean), and ‘adjusted’ distance between sites (based on constraining movement to valley bottoms) Geographic distance measure Euclidean Adjusted Scoring criteria 75 A B A 100 B 75 A B A 100 B r2 P 0.144 0.147 0.179 0.182 0.206 0.209 0.242 0.247 0.005 0.005 0.002 0.002 0.001 0.001 <0.0001 <0.0001 α = 0.05 5
