Quantitative Genetics
advertisement
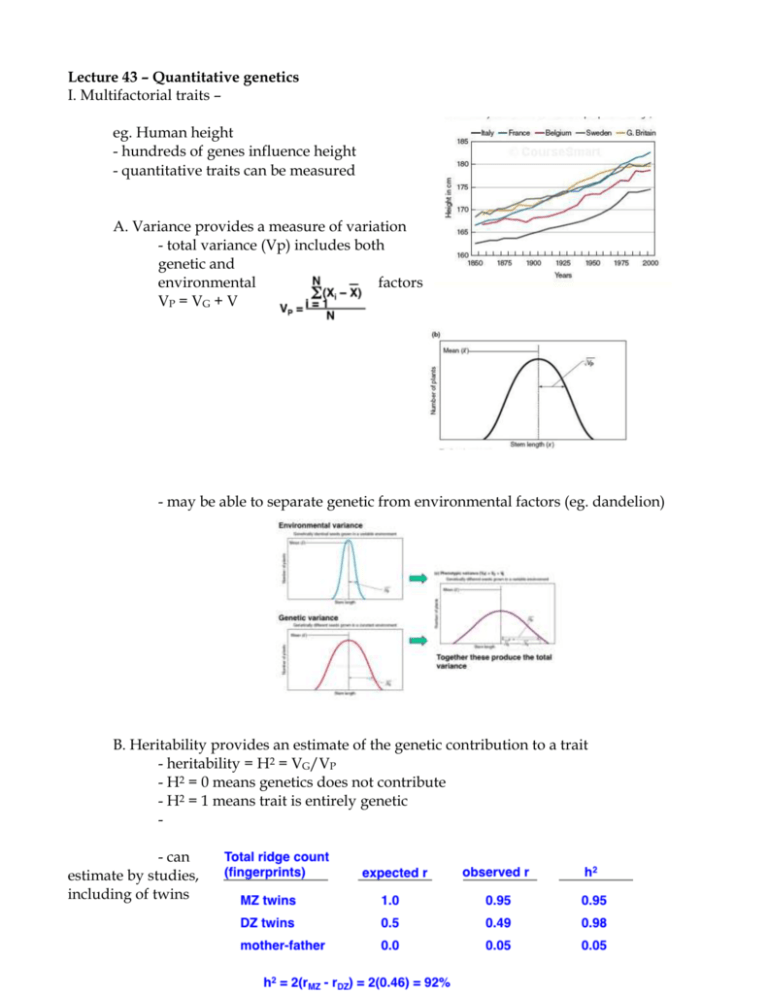
Lecture 43 – Quantitative genetics I. Multifactorial traits – eg. Human height - hundreds of genes influence height - quantitative traits can be measured A. Variance provides a measure of variation - total variance (Vp) includes both genetic and environmental factors VP = VG + V - may be able to separate genetic from environmental factors (eg. dandelion) B. Heritability provides an estimate of the genetic contribution to a trait - heritability = H2 = VG/VP - H2 = 0 means genetics does not contribute - H2 = 1 means trait is entirely genetic - can estimate by studies, including of twins 1 II. How can we get at the loci responsible for quantitative traits? A. QTL mapping - cross small “p” X large “l” - cross F1’s X large “l” - weight F2 fruit and genotype across genome “p/l” vs “l/l” - does weight differ? - For most genotypes, the answer is no but for a few it is yes (these are loci that contribute to the trait, in this case fruit size) - identified 28 loci responsible for fruit size B. How can we study QTLs in humans? 1. First a definition: linkage equilibrium = occurrence of a specific comination of alleles in cis at two or more loci at a frequency equal to the frequency of the respective allele in the population - eg. consider two linked loci, A and a each have a frequency of 50%, D and d have frequency of 10% and 90%, respectively - haplotype = group of alleles in cis at closely linked loci, inherited as unit 2. Association mapping – look for linkage disequilibrium between polymorphisms and phenotype 2 - mutation arose on some chromosome, linked to polymorphisms - generations of recombination randomized polymorphisms except for the most closely linked 3
