13 Solvents Lab
Name: ________________________________
A__: Thu, Oct 8 B__: Wed, Oct 7
#13 Solvents Lab
Mr. Wegert – Chemistry
Do Now : Read passage, annotate, and answer questions. Turn over sheet, read BOC when done.
Table 1 Passage #13
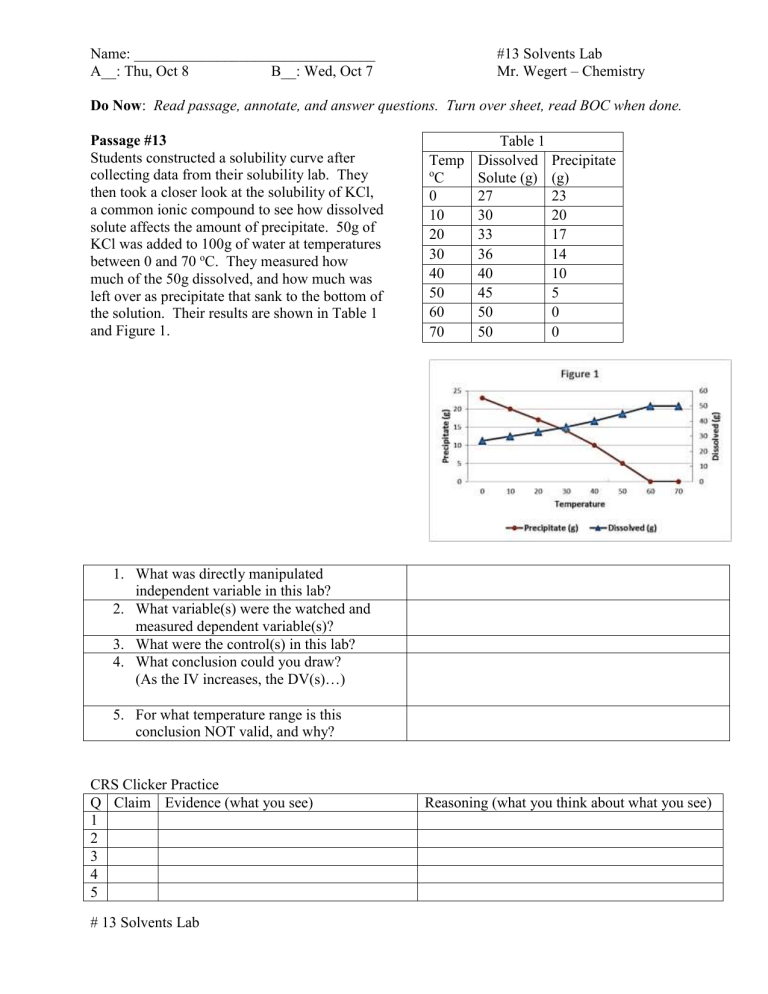
Students constructed a solubility curve after collecting data from their solubility lab. They then took a closer look at the solubility of KCl, a common ionic compound to see how dissolved o
Temp
C
0
10
Dissolved
Solute (g)
27
30
Precipitate
(g)
23
20 solute affects the amount of precipitate. 50g of
KCl was added to 100g of water at temperatures between 0 and 70 o C. They measured how much of the 50g dissolved, and how much was
20
30
40
33
36
40
17
14
10 left over as precipitate that sank to the bottom of the solution. Their results are shown in Table 1
50 45
60 50
5
0 and Figure 1. 70 50 0
1.
What was directly manipulated independent variable in this lab?
2.
What variable(s) were the watched and measured dependent variable(s)?
3.
What were the control(s) in this lab?
4.
What conclusion could you draw?
(As the IV increases, the DV(s)…)
5.
For what temperature range is this conclusion NOT valid, and why?
CRS Clicker Practice
Q Claim Evidence (what you see)
1
2
3
4
5
Reasoning (what you think about what you see)
# 13 Solvents Lab
Hypothesis: _________________________________________________________________________
Purpose: ___________________________________________________________________________
Solvent Bottles: B=Water, D=Lamp Oil, E=Ethanol
Solute Cups: A= Ammonium Chloride: NH
4
Cl, C= Copper sulfate: CuSO
4
,
N= Napthalene: C
10
H
8
, S= Salt (Sodium Chloride): NaCl, U= Urea, CO(NH
2
)
2
Procedure Checklist (in pairs)
1. Place wellplate over circles below. Use the row and column labels for what goes in the wells.
2. Add about ten drops of solvent to each well in that solvent’s row.
3. Using wooden spatula with letter that matches solute cup label, drop a very small amount of
solute into each well in that solute’s column
4. In the last column, add 2-3 drops of the +Solvent as indicated in the data table below
5. Stir the contents of the well with the clean end of a toothpick
6. Observe and record results (Yes or No if any dissolved for each well) in data table.
(You may want to use the black desktop as a background to better see what is happening)
7. Dump wellplate in DUMP beaker. Leave used wellplates in front sink.
8. Throw out used toothpicks and white paper sheets
9. Everything else goes back in bins; put back up front
10. Answer the conclusion questions below.
Homework:
1) What is the substance called that gets dissolved into a solution?
2) What is the substance called that dissolves the other substance into a solution?
3) From the lab, which solvent’s results were least like the other two?
4) From the lab, what might have been dissolved in the Snake River?
5) Honors/EC: From the lab, what was probably not dissolved in the Snake River?
Homework (write in agenda): Complete worksheet table above
# 13 Solvents Lab
____/10 pts
