Root Cause Analysis section from the Care Transition Toolkit
advertisement
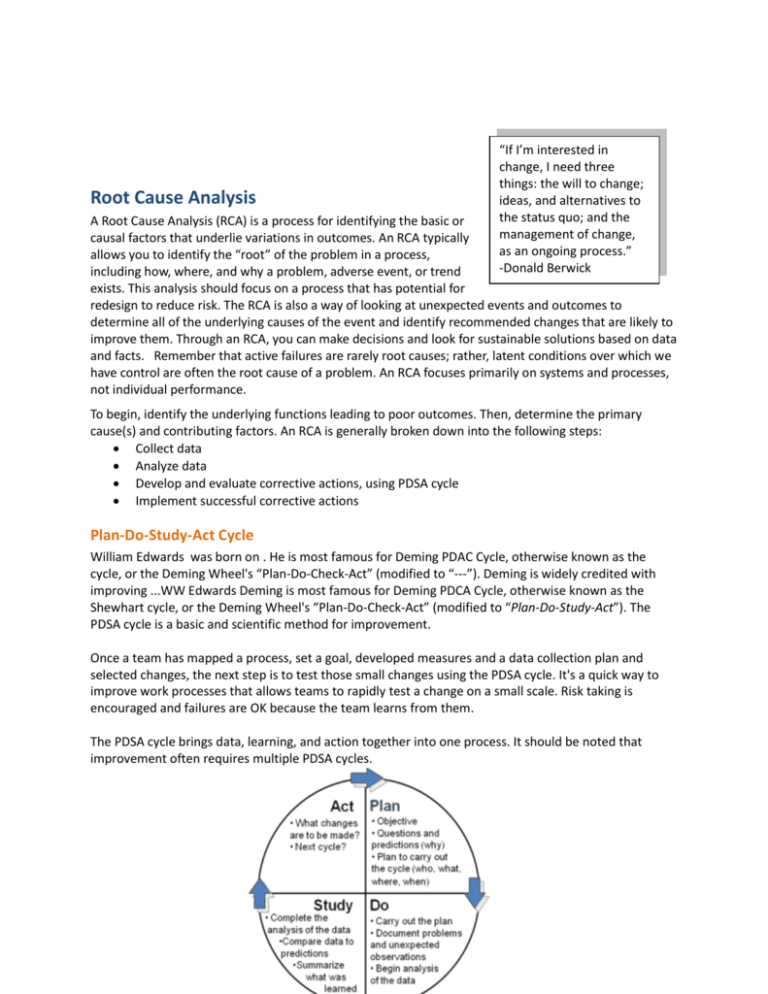
Root Cause Analysis “If I’m interested in change, I need three things: the will to change; ideas, and alternatives to the status quo; and the management of change, as an ongoing process.” -Donald Berwick A Root Cause Analysis (RCA) is a process for identifying the basic or causal factors that underlie variations in outcomes. An RCA typically allows you to identify the “root” of the problem in a process, including how, where, and why a problem, adverse event, or trend exists. This analysis should focus on a process that has potential for redesign to reduce risk. The RCA is also a way of looking at unexpected events and outcomes to determine all of the underlying causes of the event and identify recommended changes that are likely to improve them. Through an RCA, you can make decisions and look for sustainable solutions based on data and facts. Remember that active failures are rarely root causes; rather, latent conditions over which we have control are often the root cause of a problem. An RCA focuses primarily on systems and processes, not individual performance. To begin, identify the underlying functions leading to poor outcomes. Then, determine the primary cause(s) and contributing factors. An RCA is generally broken down into the following steps: Collect data Analyze data Develop and evaluate corrective actions, using PDSA cycle Implement successful corrective actions Plan-Do-Study-Act Cycle William Edwards was born on . He is most famous for Deming PDAC Cycle, otherwise known as the cycle, or the Deming Wheel's “Plan-Do-Check-Act” (modified to “---”). Deming is widely credited with improving ...WW Edwards Deming is most famous for Deming PDCA Cycle, otherwise known as the Shewhart cycle, or the Deming Wheel's “Plan-Do-Check-Act” (modified to “Plan-Do-Study-Act”). The PDSA cycle is a basic and scientific method for improvement. Once a team has mapped a process, set a goal, developed measures and a data collection plan and selected changes, the next step is to test those small changes using the PDSA cycle. It's a quick way to improve work processes that allows teams to rapidly test a change on a small scale. Risk taking is encouraged and failures are OK because the team learns from them. The PDSA cycle brings data, learning, and action together into one process. It should be noted that improvement often requires multiple PDSA cycles. In addition to the PDSA cycle, some communities may focus on rapid cycle improvement. Rapid cycle is the use of standard quality tools with skilled facilitators to achieve breakthrough improvements in performance within a rapid time frame. Rapid cycle uses the same basic principles as the PDSA cycle, but the work is accelerated through a series of cycles to make a change. Action/Implementation Plan “When it is obvious that the goals cannot be reached, don't adjust the goals, adjust the action steps.” -Confucius After you have determined the root cause(s), then it is time to develop an Action or Implementation Plan. Plans are necessary to pilot the improvement experiment and determine future adjustments for improvement. When designing the Action or Implementation Plan, be very specific about the changes being made. Clearly answer each of the following components in a brief outline to help create a plan that is easy to follow and ensures accountability for achieving specific tasks by target deadlines. Identify strategies to reduce risks of similar events occurring in the future Address responsibility for implementation, oversight Address ongoing measurement to determine effectiveness of the actions Create a timeline for multiple actions Set reasonable/attainable goals Link goals to measurement Select changes that have the highest potential impact community-wide, but test one change in one area first Community Assessment QIOs performed comprehensive community assessments within the first month of the project to direct and refine intervention strategies. Assessment items included: Willingness of community to come together for the initiative Population demographics Claims data analysis of care patterns associated with readmissions Local perceptions of drivers of readmissions Tabulation of existing quality improvement activities Priorities of committed participants The presence of other relevant community infrastructure, such as “We can’t solve Health Information Exchanges, Aging Network services and Certified problems by using Value Exchanges the same kind of thinking we used Teams can perform root cause analyses using traditional quality when we created improvement methods within their communities to determine the main them.” drivers of readmissions. In the 9th SOW, QIOs used a variety of techniques -Albert Einstein for the root cause analyses, including: 1. Medical Record Reviews: these included reviews of randomly sampled hospital discharges, reviews of 30-day readmissions, as well as reviews of other services provided such as skilled nursing, home health or physician follow-up services. 2. Process Assessment: this included direct observation of processes such as discharge and admission, interviews with process owners, and mapping of processes. 3. Group Discussion & Individual Interviews: QIOs gained tremendous insight from both crosssetting group discussions as well as individual interviews with both providers and patients. Tools There are a variety of methods and tools available to help conduct a Root Cause Analysis when initiating a care transitions effort within your community. Some of the more common techniques include medical record reviews, process mapping, cause and effect diagrams, fault tree analyses, LEAN value stream mapping, 5-Whys, group or individual interviews, and focus groups, etc. Medical Record Reviews Medical record reviews can help to identify trends and patterns within specific provider settings. These reviews might include randomly sampled hospital discharges, reviews of 30-day readmissions, as well as reviews of other services provided such as skilled nursing, home health or physician follow-up services. Process mapping is a technique used for visual representation of work processes in a form of a map. The process map is a basic tool for process improvement and identifies a variety of activities, including input and output, approvals, exceptions, and hand-offs. The goal of the map is to provide a clear vision of a process, so that participating organizations and individuals gain an understanding of their specific role in the overall system or community. The process map should identify bottlenecks and delays, rework, and unnecessary steps within the process. The map should represent the process flow from the beneficiary’s point of view, showing whether each step of the process helps create a clear value for the individual or patient. - Link to Utilization Reduction Data Tracking Template: IN This brief one-page utilization data tracking template includes information necessary to track utilization including LOS, number of hospitalizations, average cost/DRG and number of patient days. - Readmission Chart Review tool: NJ This two-page readmission chart review tool is detailed and includes all topics related to readmission and care transitions. - Hospital Readmission Review Tool: PA This readmission review tool is a checklist of detailed topics related to readmission and care transitions. - Chart Review Audit Tool (Home Health, Hospital): PA Home Health: This chart review audit tool is specific to home health hospital readmissions. Hospital: This is a brief one-page hospital readmission review tool including topics related to care transitions. - Abstraction Template (General, Skilled Nursing Facilities, Home Health Agencies): WA General: This is a four-page very detailed care transitions abstraction template tool. Skilled Nursing Facilities: This is a simple but detailed four-page care transitions abstraction template tool for SNF. The majority of the topics are in a yes/no format. Home Health Agency: This is a four-page very detailed care transitions abstraction template tool formatted for the home health setting. - Readmission worksheet: GA This 3-page readmission worksheet may be used to assist in identifying gaps in care and aid in care transition quality improvement directives. Process Assessment Assessing a process in its current state can be helpful to develop benchmarks and determine where improvement can occur. Assessments might include direct observation of processes such as discharge and admission, interviews with process owners, and mapping of processes. A variety of methods are outlined below. “No problem can stand the attack of sustained thinking.” -Voltaire Process Mapping Process mapping helps to clarify specific roles and contributions of the process participants and identify opportunities for improvement. A clear view of the entire system provides a framework for multiple improvement approaches and allows process reengineering on defined, community or beneficiaryoriented basis. Cause-and-Effect Diagram A Cause-and-Effect Diagram is a tool that can help to identify, sort, and display potential causes of a specific problem or quality characteristic. It visually illustrates the relationship between a given outcome and all the factors that may influence that outcome. This type of diagram is sometimes called an "Ishikawa diagram" or a "fishbone diagram". This tool is useful for identifying and organizing the known or possible causes of quality, or the lack thereof. The structure provided by the diagram helps team members to think and brainstorm in a very systematic way. Some of the benefits of constructing a Cause-and-Effect Diagram are that it encourages group participation, utilizes group knowledge of the process, uses an orderly format to diagram cause-and-effect relationships, indicates possible causes of variation in a process, increases knowledge of the process, and identifies areas where data or more information should be collected for further review. Patient Factors (Beneficiaries) Processes System Medication Discrepancies Lack of Physician Follow-up Inconsistent Information: Among Providers & Patients Aging Population Decreased Mortality Patient Medication Discrepancies Decrease in Length of Stay Increase in Co-morbidities Lack of Follow-up with Physician after Discharge Poor Self-Care Management Skills Increase in HF 30-Day Readmission Rates Physicians Not Willing to Follow-up with Recent Discharges Inadequate Discharge Follow-Up Increased Incidence of HF Nutritional Deficiencies Economic Impact Systems (Environment) Measures Fault Tree Analysis A Fault Tree Analysis graphically represents the interaction of failures and other events within a system or process. Basic events at the bottom of the fault tree are linked to one or more TOP events. These TOP events represent identified hazards or system failure modes for which predicted reliability or availability data are required. Fault trees are often used when the effect of a failure is known to find out how this might be caused by a combination of other failures within a large or complex system. When a solution has been previously identified, this analysis can be helpful to understand potential failures and determine more sustainable and effective solutions. It also helps to identify risks in a system and proactively develop risk reduction strategies and measures. Value Stream Mapping Value stream mapping is a lean manufacturing technique used to analyze the flow of materials and information currently required to bring a product or service to a consumer. Lean principles are built on a five-step thought process for guiding the implementation of effective techniques1. 1. Specify value from the standpoint of the end customer by product family. 1 Lean Enterprise Institute. Principles of Lean. http://www.lean.org/WhatsLean/Principles.cfm 2. Identify all the steps in the value stream for each product family, eliminating whenever possible those steps that do not create value. 3. Make the value-creating steps occur in tight sequence so the product will flow smoothly toward the customer. 4. As flow is introduced, let customers pull value from the next upstream activity. 5. As value is specified, value streams are identified, wasted steps are removed, and flow and pull are introduced, begin the process again and continue it until a state of perfection is reached in which perfect value is created with no waste. For the care transitions effort, Lean efforts and value stream mapping can be used to understand more about the process by which a patient is discharged from the hospital to another care setting and then readmitted. The goal is to depict flow of information throughout all value-adding processes required to provide a service to the individual. Value stream maps document each step of the process to understand both value-adding and non-value-adding (waste) processes and steps. A current state map is initially produced, which becomes the baseline for improvement. Then, a future state map is produced, documenting a more streamlined and valuable approach to the process with a focus on eliminating waste and increasing efficiencies. 5-Whys The ‘5 Whys’ is a technique used in the Analyze phase of the Six Sigma methodology. This Six Sigma method does not involve a statistical hypothesis and in many cases can be completed without a data collection plan. This technique can help to identify the root cause of a problem, determine the relationship between different root causes of a problem, and is simple and easy to complete without statistical analysis. To complete the ‘5 Whys’, start with writing down the specific problem. Then, ask why the problem happens and record the answer. If the answer provided does not directly identify the root cause of your initial problem, ask ‘Why’ again, and record the answer. Continue this process until the team agrees the problem’s root cause has been identified. This process is often complete within five cycles, but can take more or less, depending on the problem. Example: Q: Why are so many Medicare beneficiaries with heart failure being readmitted to the hospital? A: Because they do not understand or remember the red flags related to their condition after discharge. Q: Why do they not understand the red flags? A. They do not have the correct documentation or reminder systems in place. Q: Why do they not have the proper documentation or reminders? A. Because they did not receive a Personal Health Record or Red Flag magnet with documentation of these red flags upon discharge. Q. Why did they not receive the PHR or magnet? A. Distribution of these materials is not part of the current discharge process. By asking a sequence of ‘Whys’, one can deduce the root cause of a heart failure patient being readmitted to not having a process in place at discharge to educate them on red flags for their specific condition. Individual and Group Interviews Individual interviews can help to identify patterns, trends, and opportunities for improvement from the staff member and beneficiary perspectives. Group discussion and interviews often allow for reflection and brainstorming of challenges and opportunities. This open-ended format can produce data and insights that may be less accessible without interaction found in a group setting—listening to others’ verbalized experiences can stimulate memories, ideas, and experiences in participants. These groups can be formulated across settings, or within provider teams, organizations, or specialties. Tremendous insight can be gained from these interviews to identify drivers of rehospitalizations in your own community. - Link to Discharge Follow-Up tracking tool (Excel): RI This safe transitions hospital discharge tracking tool includes follow-up phone call questions which generates summary data. - Link to Follow-Up Phone call tracking tool (Excel): MI This follow-up phone call tracking tool includes follow-up phone call questions and summary data that generates bar graphs to display monthly trends. - Link to Follow-Up Phone Call Data Collection Tool (Excel): GA This follow-up phone call tracking tool allows data collection regarding red flags, understanding of medications, follow-up appointments, etc. and generates monthly trend graphs. Focus Groups Focus groups can be another qualitative research method for gaining insight related to reducing readmissions within the community. This structured format allows for individuals to discuss their perceptions, opinions, beliefs and attitudes. Prior to convening a focus group, consider your goals and objectives. Develop a list of questions to help drive the session and be sure to have a skilled facilitator to moderate the discussion and topic areas to be addressed. Focus groups typically run 1 – 2 hours with 6 – 10 participants. Be sure that all members are comfortable speaking freely within the group; often this can be achieved by convening like participants. To gain a higher level view, consider convening multiple focus groups of varying individuals (i.e., physicians across settings, home health nurses in the community, readmitted beneficiaries, etc.). - Office Manager Focus Group Summary: NJ This is an example of a brief one-page office manager focus group summary. - Office Manager Focus Group Report: NJ This is an example of a 30-page very detailed office manager focus group report that was moderated by an outside source and professionally documented. RCA Results from 9th SOW Communities Review of medical records and root causes analyses revealed remarkably consistent results. In general, patients experienced readmissions because of unmanaged worsening of their conditions, the use of suboptimal medication regimens, and returning to emergency departments instead of accessing a different type of medical service. The root causes of these problems could be attributed to 3 basic system gaps or drivers of readmission: “The most effective way to manage change successfully is to create it.” - Peter F. Drucker 1. Lack of engagement or activation of patients and families into effective post-acute self management, 2. Lack of standard and known processes among providers for transferring patients and medical responsibility, and 3. Ineffective or unreliable sharing of relevant clinical information. Many of the evidence-based interventions to improve transitional care are directed at one or more of these gaps, but require cooperative activity by more than one provider. All projects have therefore needed to incorporate efforts directed at building cross-setting or multi-provider relationships to deploy, measure, and revise implementation strategies. Most sites have extended from relationship building into general community-building as necessary groundwork to enable improvement.
