Experiment 2
advertisement
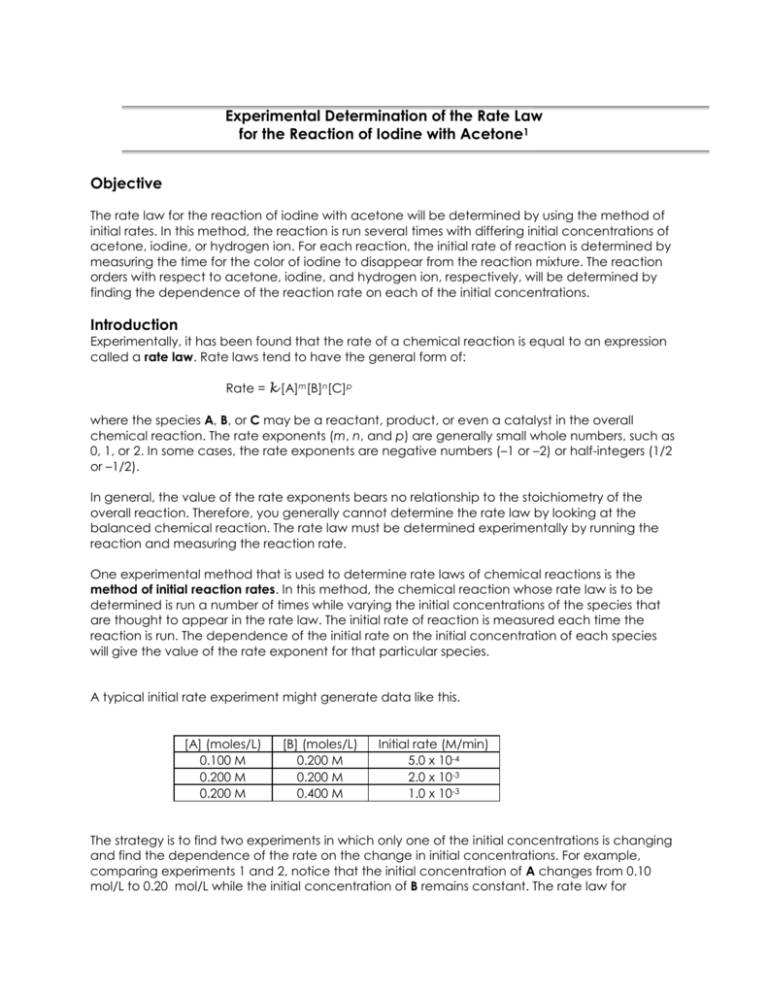
Experimental Determination of the Rate Law for the Reaction of Iodine with Acetone1 Objective The rate law for the reaction of iodine with acetone will be determined by using the method of initial rates. In this method, the reaction is run several times with differing initial concentrations of acetone, iodine, or hydrogen ion. For each reaction, the initial rate of reaction is determined by measuring the time for the color of iodine to disappear from the reaction mixture. The reaction orders with respect to acetone, iodine, and hydrogen ion, respectively, will be determined by finding the dependence of the reaction rate on each of the initial concentrations. Introduction Experimentally, it has been found that the rate of a chemical reaction is equal to an expression called a rate law. Rate laws tend to have the general form of: Rate = k [A]m[B]n[C]p where the species A, B, or C may be a reactant, product, or even a catalyst in the overall chemical reaction. The rate exponents (m, n, and p) are generally small whole numbers, such as 0, 1, or 2. In some cases, the rate exponents are negative numbers (–1 or –2) or half-integers (1/2 or –1/2). In general, the value of the rate exponents bears no relationship to the stoichiometry of the overall reaction. Therefore, you generally cannot determine the rate law by looking at the balanced chemical reaction. The rate law must be determined experimentally by running the reaction and measuring the reaction rate. One experimental method that is used to determine rate laws of chemical reactions is the method of initial reaction rates. In this method, the chemical reaction whose rate law is to be determined is run a number of times while varying the initial concentrations of the species that are thought to appear in the rate law. The initial rate of reaction is measured each time the reaction is run. The dependence of the initial rate on the initial concentration of each species will give the value of the rate exponent for that particular species. A typical initial rate experiment might generate data like this. [A] (moles/L) 0.100 M 0.200 M 0.200 M [B] (moles/L) 0.200 M 0.200 M 0.400 M Initial rate (M/min) 5.0 x 10⁻⁴ 2.0 x 10⁻³ 1.0 x 10⁻³ The strategy is to find two experiments in which only one of the initial concentrations is changing and find the dependence of the rate on the change in initial concentrations. For example, comparing experiments 1 and 2, notice that the initial concentration of A changes from 0.10 mol/L to 0.20 mol/L while the initial concentration of B remains constant. The rate law for experiments 1 and 2 are: Rate2 = k [ A]m2 [ B]m2 Rate1 = k [ A]1m [ B]1m Divide the rate law for experiment 2 by the rate law for experiment 1. The rate constant, k, will cancel out as will the [B] since the [B] is the same for both experiments. All that remains is Rate2 Rate1 = [ A] m2 [ A]1m When the experimental data is inserted into the equation, you get 2.0 x 10⁻³ M/min 5.0 x 10⁻⁴ M/min = 4 2 (0.200 M)m (0.100 M)m = = 2m m The order for the reaction with respect to A is second-order. Similar calculations would let you determine the order of the reaction with respect to B. Once the order of the reaction for A and B have been determined, you can use any of the experiments to calculate the rate constant, k. Rate [A]m[B]n = k The units on the rate constant vary depending on the overall order of the rate law. The Experiment In today’s experiment, you will determine the rate law for the reaction of iodine with acetone to produce iodoacetone: CH3COCH3 (aq) + I2 (aq) CH3COCH2I (aq) + HI (aq) Using structural formulas for acetone and iodoacetone, this equation is represented as: O H3C O CH3 + I2 H+ + HI H3C CH2I Since this equation is catalyzed by the hydrogen ion, H +(aq), the concentration of H+ appears in the rate law as well as the concentrations of acetone and I 2. The general form for the rate law for this equation is: Rate = k [CH3COCH3]M [I2] n [H+]p You will determine the value of the rate exponents (m, n, and p) and the value of the rate constant k using the method of initial rates. In this method, you will measure the rate of reaction for several runs of the reaction, varying the initial concentration of one species in the rate law at a time. The rate of reaction will be determined by measuring the time it takes for the brown color of iodine in aqueous solution to disappear. You will measure the brown color spectroscopically using a UV-visible spectrometer. The rate of the reaction will be equal to the average rate of the reaction over the time period that the reaction is studied. The assumption is that all of the iodine is used up in the course of the reaction. The negative sign is included because iodine is a reactant. Average rate = - [I2]final - [I2]initial timefinal - timeinitial Average rate = - 0 M - [I2]initial timefinal - 0 sec The experiment will be run a total of 7 times with different initial concentrations of acetone, iodine, and hydrogen ion. The recipes for making the seven different solutions are given in table below. The initial concentrations of each species are determined by using the dilution formula. Figure 1 Schematic Diagram for a spectrophotometer Any solution that is colored will absorb at a particular wavelength of visible light. An instrument that is used to measure the absorbance of light by a sample is called a spectrophotometer. A general schematic diagram for a spectrophotometer is shown above in Figure 1. It begins with a light source or a light bulb. For the instrument that is used in this lab, the light bulb emits light of wavelengths ranging from 340 nm to 600 nm. The light then travels to a monochromator. The monochromator separates the light into its individual wavelengths so that light of a particular wavelength shines towards the sample. A simple monochromator is a glass prism. In modern instruments, a polished grating is used to separate the light into its individual wavelengths. After passing through the monochromator, light of a particular wavelength with intensity equal to I0 is passed through the sample. As the light passes through the sample, part of the light may be absorbed. This absorption lowers the intensity of the light. The intensity of the light after it passes through the sample is equal to I. The detector measures this intensity. The spectrophotometer expresses the amount of light absorbed in one of two ways. The first way of measuring the amount of light absorbed is called the percent transmittance, %T, which is defined as follows: %T = I x 100 Io The second way of measuring the amount of light absorbed is called the absorbance, A. It is defined as follows: A = 2 - log %T When a sample completely absorbs no light at all (all light is transmitted), %T = 100 and A = 0.000. As a sample absorbs a larger fraction of light (less light is transmitted), %T will decrease and A (the amount of light absorbed) will increase. Laboratory Procedure This experiment will be performed with lab partners. Although the experimental procedure is performed in pairs, the calculations should be performed separately. Figure 2: A typical Spectronics 20 spectrometer 1. First, the Spectronics 20 spectrometer must be calibrated at the proper wavelength. A picture of the important knobs on the spectrometer is shown in Figure 2 above. Set the wavelength of the spectrometer at 410 nm. With nothing in the sample-holder, adjust the power switch knob until the %T reading is equal to zero. Obtain a cell and fill it between half and three-quarters full with deionized water and place it into the sample holder. Adjust the transmittance/absorbance knob until the %T reading is equal to 100%. The spectrometer is then ready for use. 2. Set up four burettes on each lab bench. Label a burette for acetone, for HCl, for water, and for iodine. Fill each burette with the indicated solution. The burettes will be shared by all of the people working on a bench. 3. Obtain 14 small beakers. As specified in the table below, dispense from the burette the required amounts of each solution into the beakers. Beaker A contains the acetone, HCl, and deionized water. Beaker B contains the iodine solution. Be sure to keep the beakers for each run ordered in the proper order. Label a piece of paper toweling like the one shown in the picture below to keep the beakers clearly identified. Beaker A Beaker B 1 2 3 4 5 6 7 Table 1 Amounts of each solution to be measured for each run BEAKER A Beaker B Run Number 1 4.0 M acetone 1.0 M HCl deionized H2O 0.0050 M I2 3.00 mL 3.00 mL 8.00 mL 4.00 mL 2 6.00 mL 3.00 mL 5.00 mL 4.00 mL 3 9.00 mL 3.00 mL 2.00 mL 4.00 mL 4 5 6 7 3.00 mL 3.00 mL 3.00 mL 3.00 mL 6.00 mL 9.00 mL 3.00 mL 3.00 mL 5.00 mL 2.00 mL 4.00 mL 0.00 mL 4.00 mL 4.00 mL 8.00 mL 12.00 mL 4. Take the cell out of the spectrometer and empty the contents. For run #1, pour the contents of beaker A into beaker B and quickly mix the solution by stirring. As one person begins mixing the solutions, the other partner should start the timing the reaction. Quickly pour a small amount of the mixed solution into the spectrometer cell and swirl in the cell and discard. Then fill the cell about ¾ full with the solution and place in the spectrometer. 5. The spectrometer should be reading a certain %T reading dependent on the amount of iodine contained in the solution. As the reaction proceeds and the iodine is consumed, the color will disappear and the %T reading will increase. (More light will be transmitted through a clear solution than a colored solution.) Therefore, the %T reading on the spectrometer should increase at a fairly constant rate. The reaction can be considered complete when the %T reading stops increasing. This will usually occur in the 90%-100% region. Stop timing when the %T reading stops increasing. You may want to record the earliest time at which you observe % becoming constant and then continue to observe the change in %T for an addition minute. This will allow you to confidently record the time it takes for the reaction to go to completion. Record the time elapsed on your data sheet. 6. Repeat steps 4 and 5 for the seven sets of initial concentrations as prescribed in table above. Calculations 1. Calculate the initial concentrations of acetone, iodine, and hydrogen ion by applying the dilution formula: MinitialVinitial = MfinalVfinal 2. The initial concentration of acetone, hydrochloric acid, and iodine can be found on the reagent bottles. The initial volumes are the measured volumes for each run as specified in table above. The final volume is the total volume of the mixed solution, which for each run is 18.00 mL. 3. The rate of reaction for each run is calculated by finding the average rate of the reaction as explained in the introduction. 4. Calculate the value of m, of n, and of p. Round to the nearest whole number. Each order (m, n, and p) can be calculated two different ways. For example, comparing runs 1 and 2 will give you a value for m. Comparing runs 1 and 3 will also give you a value for m. The two values should be within 10% of each other or you should repeat runs 1-3. Show both possible calculations for m, for n, and for p. Calculate the percent difference for between each pair of values for m, for n, and for p. 5. Calculate the value of the rate constant k by placing in the initial concentrations and the initial rates into the rate law and solving for k for each run. You should calculate a value of the rate constant k for each run and average all 7 values to come up for a value for your rate constant. Don’t forget to put to appropriate units on your value of the rate constant. 1Based on an experiment designed by Dr. Arthur A. Low at Tarleton State University Department of Geosciences and Chemistry
