Qualitative Analysis for Fe3+, Ba2+, Ni2+, Pb2+, and Ag+
advertisement
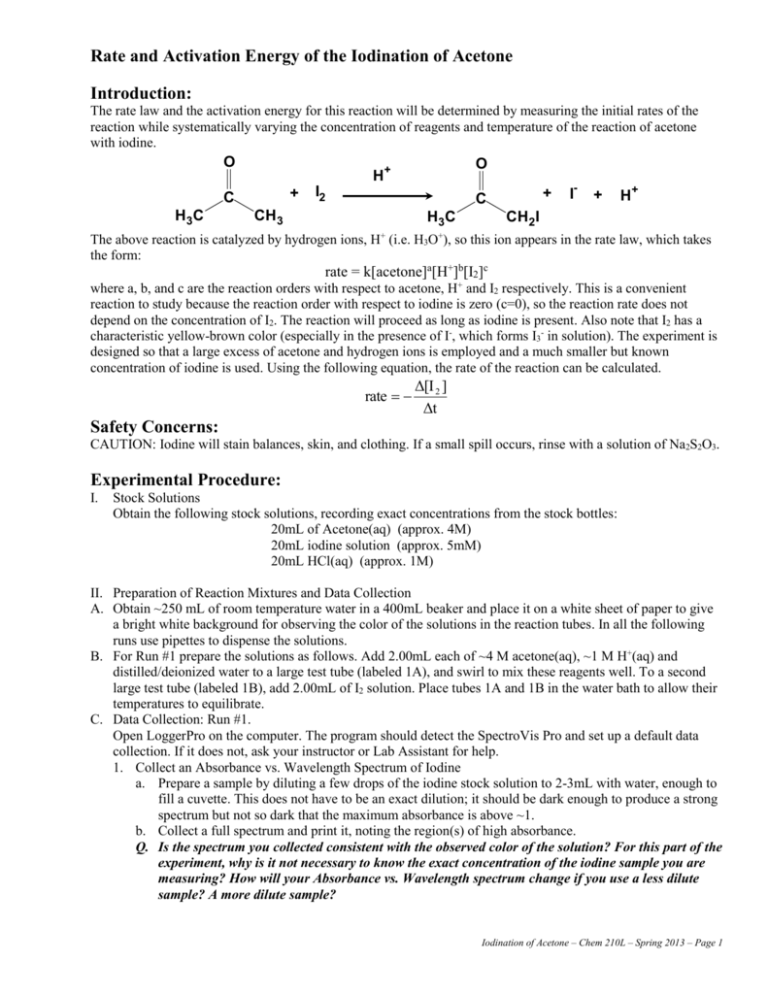
Rate and Activation Energy of the Iodination of Acetone Introduction: The rate law and the activation energy for this reaction will be determined by measuring the initial rates of the reaction while systematically varying the concentration of reagents and temperature of the reaction of acetone with iodine. O + C H3C O H+ I2 + C CH3 H3C + I- + H+ CH2I + The above reaction is catalyzed by hydrogen ions, H (i.e. H3O ), so this ion appears in the rate law, which takes the form: rate = k[acetone]a[H+]b[I2]c where a, b, and c are the reaction orders with respect to acetone, H+ and I2 respectively. This is a convenient reaction to study because the reaction order with respect to iodine is zero (c=0), so the reaction rate does not depend on the concentration of I2. The reaction will proceed as long as iodine is present. Also note that I2 has a characteristic yellow-brown color (especially in the presence of I-, which forms I3- in solution). The experiment is designed so that a large excess of acetone and hydrogen ions is employed and a much smaller but known concentration of iodine is used. Using the following equation, the rate of the reaction can be calculated. rate Δ[I 2 ] Δt Safety Concerns: CAUTION: Iodine will stain balances, skin, and clothing. If a small spill occurs, rinse with a solution of Na2S2O3. Experimental Procedure: I. Stock Solutions Obtain the following stock solutions, recording exact concentrations from the stock bottles: 20mL of Acetone(aq) (approx. 4M) 20mL iodine solution (approx. 5mM) 20mL HCl(aq) (approx. 1M) II. Preparation of Reaction Mixtures and Data Collection A. Obtain ~250 mL of room temperature water in a 400mL beaker and place it on a white sheet of paper to give a bright white background for observing the color of the solutions in the reaction tubes. In all the following runs use pipettes to dispense the solutions. B. For Run #1 prepare the solutions as follows. Add 2.00mL each of ~4 M acetone(aq), ~1 M H+(aq) and distilled/deionized water to a large test tube (labeled 1A), and swirl to mix these reagents well. To a second large test tube (labeled 1B), add 2.00mL of I2 solution. Place tubes 1A and 1B in the water bath to allow their temperatures to equilibrate. C. Data Collection: Run #1. Open LoggerPro on the computer. The program should detect the SpectroVis Pro and set up a default data collection. If it does not, ask your instructor or Lab Assistant for help. 1. Collect an Absorbance vs. Wavelength Spectrum of Iodine a. Prepare a sample by diluting a few drops of the iodine stock solution to 2-3mL with water, enough to fill a cuvette. This does not have to be an exact dilution; it should be dark enough to produce a strong spectrum but not so dark that the maximum absorbance is above ~1. b. Collect a full spectrum and print it, noting the region(s) of high absorbance. Q. Is the spectrum you collected consistent with the observed color of the solution? For this part of the experiment, why is it not necessary to know the exact concentration of the iodine sample you are measuring? How will your Absorbance vs. Wavelength spectrum change if you use a less dilute sample? A more dilute sample? Iodination of Acetone – Chem 210L – Spring 2013 – Page 1 2. Setting Up LoggerPro to Measure Reaction Times a. From the “Experiment” menu in LoggerPro, choose “Data Collection” and switch to a “Time Based” experiment with the following parameters: Experiment length = 10 minutes Continuous sampling = ON Sampling rate = 35 samples per minute b. Click on the “Configure Spectrometer” button c. Click “Individual Wavelengths” from the drop-down menu and select the wavelength(s) that you would like to observe for your experiment. You do not have to observe the peak wavelength, but you should observe a wavelength that is near the peak. 3. Measuring the Reaction Time for Run #1 a. Remove Tubes 1A and 1B from the room temperature water bath and prepare to mix them. b. Click the “Collect” button to start the data collection as you pour the contents of Tube 1A into Tube 1B. You should click “Collect” at the same moment that the solutions mix! Pour the mixture back and forth a few times to mix thoroughly. Fill a cuvette with the mixture and place it in the SpectroVis Pro. c. Collect data until the absorbance levels out at or near zero. From the “Analyze” menu, choose “Examine” to find the time that the reaction is complete. You do not need to print these graphs, just record the time at which the absorbance levels out near zero. If the color of your sample does not fade significantly in 2 minutes, inform your instructor or Lab Assistant. 4. Repeat your data collection of Run #1 until your times agree within 10%. Q: What is the difference between a reaction time and a reaction rate? You have measured reaction times, what do you have to do to determine the reaction rate for each run? Does a long reaction time correspond to a “fast” or a “slow” reaction rate? D. Data Collection: Cold Run. Prepare samples “CA” and “CB” with the same reagents and volumes as “1A” and “1B” above. Prepare a separate blank (or reference tube) for the low temperature run, by adding about 8mL of distilled water to a clean large test tube. Allow tubes CA, CB, and the blank to equilibrate in an ice/water bath (~0ºC) for at least 5 minutes. Once the tubes are cold, quickly mix CA and CB. Record the time at the point of mixing to the nearest second and return the tube to the ice/water bath. Follow the course of the reaction by visually comparing the reaction solution with the blank, the Cold Run NEVER GOES IN THE SPECTROVIS PRO, you are monitoring the loss of color BY EYE. As the ice in the bath melts, continue to add ice to keep the temperature of the bath constant. Record the time when the I2 color has disappeared. The cold run takes a long time. Leave the system to react and continue on with the room temperature runs. Keep an eye on this cold run reaction mixture and record the time required for the reaction to reach completion. Q: Why does the cold run take longer than the room temperature runs? Explain your answer on a molecular level. E. Data Collection: Additional room temperature runs You will be determining the order of this reaction with respect to the various reactants by comparing additional reaction to the “standard” reaction you performed above (Run #1). Design a series of additional experiments that you can use to determine the order of this reaction with respect to acetone, acid and iodine concentrations using the following guidelines: 1. Change only 1 variable at a time. Changing multiple variables will make it more difficult (although not necessarily impossible) to interpret your results. 2. The total volume of your sample should always be 8.00mL 3. Distilled/deionized water is present only to make the total volume of the solution 8.00mL. For example, if you choose to double the amount of acetone in the experiment to 4.00mL, then you should omit the water. (4.00mL acetone(aq) + 2.00mL HCl(aq) + 2.00mL I2(aq) = 8.00mL) 4. Consider the equipment that is already available in the lab. All measurements in your plan will have to be performed using the available equipment. For each set of conditions, make repeat measurements until you are confident in your results. You will need at least 3 different sets of conditions to fully interpret your experiment. Your plan must be written down and checked by your instructor or Lab Assistant before you continue. Complete all of your room temperature reactions during the first week. Iodination of Acetone – Chem 210L – Spring 2013 – Page 2 After completing all of your room temperature experiments, you may stop lab work. Before next lab, calculate the concentrations of all reactants, calculate the reaction rates, and plan your experiments for next week. F. Prepare a second “Cold” run using the same conditions as in week 1. While this is reacting, prepare a “Cool” water bath at approximately 10ºC. You may choose to monitor this bath temperature by using the temperature probe and a temperature vs. time data collection in LoggerPro. Stirring the bath with a magnetic stir bar, try to keep the temperature within ±0.5ºC by adding an ice chip or two when the bath starts to warm up. Prepare at least 2 “Cool” runs using the same volumes as the “Cold” runs. Monitor these reactions visually as you did with the “Cold” run. III. Data Analysis: This experiment generates a LOT of data; it is probably best to organize this data in a table or multiple tables to keep it straight. There are also quite a few repetitive calculations in this experiment, you may wish to use MSExcel or another spreadsheet to perform your calculations. A. Calculate the actual initial concentration of all reagents used in each reaction mixture. Q: What is the difference between an “initial concentration” and a “stock concentration”? What is the limiting reagent in each of the experiments you performed? Is this consistent with your observations? What would you observe if the limiting reagent were different? B. Calculate the average rate of each experiment from trials. C. Qualitative determination of order with respect to each reactant. Comparing your runs to Run #1, you should be able to determine the order with respect to each reactant, assuming that they should (theoretically) be integers 0, 1, or 2. For example, if you double the concentration of iodine and the reaction rate is essentially unchanged, the order of the reaction with respect to iodine must be zero. D. Quantitative determination of orders with respect to each reactant. The orders with respect to each reactant can also be determined mathematically. In theory, the values should be integers, so determining their exact mathematic value is not always necessary, but it does allow a more complete analysis of the experimental error. Set up a ratio of two runs, cancel everything you can cancel, and use a logarithm to solve for the exponent that’s left over. Q: Why is there error in your result? Create a list of sources of error in this experiment and estimate the extent of each source. For example, if the HCl(aq) stock solution is listed as “1.00M”, there is error in that last digit; the “real” concentration is somewhere between 0.99M and 1.01M. That’s a 1% error. Is 1% a significant error in this experiment? E. Calculate k, the rate law constant, for each of the runs, and the average value of k for all of your room temperature runs. Q: How much error is there in your average room temperature k? How does this error impact the number of significant figures you can legitimately report in your value of k? Q: How does your average room temperature value of k compare to the value of k for your cold run? Is this difference consistent with the rates you observed for the reaction? F. The activation energy, Ea, may be determined using either the comparative form (for any 2 points) or the linear form (for all 3 points) of the Arrhenius equation. Calculate Ea mathematically for each pair of temperatures (Room/Cool, Room/Cold, Cool/Cold), and graphically using all three temperatures. See your text for details. Q: How do your pair-wise activation energies compare to one another? How do they compare to the graphically determined value? Which value do you prefer? Q: Is this a “large” activation energy? How does the activation energy of a reaction influence the rate of the reaction? Did this reaction seem very fast, very slow or somewhere in the middle of the road? Iodination of Acetone – Chem 210L – Spring 2013 – Page 3
