Linear Regression & Correlation
advertisement
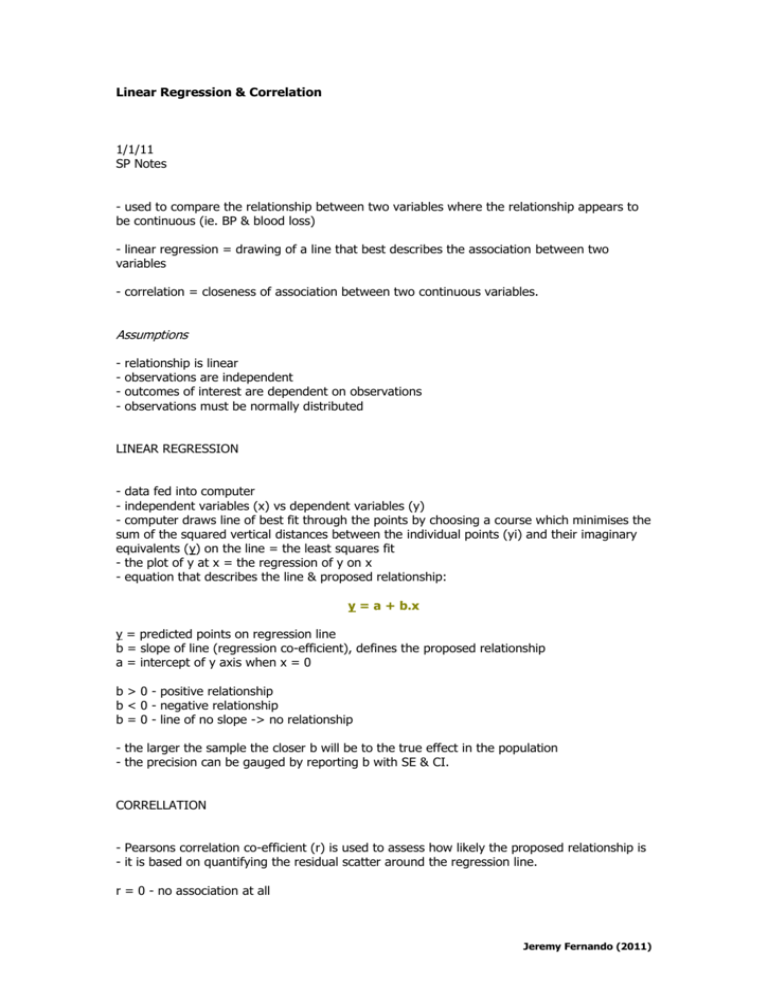
Linear Regression & Correlation 1/1/11 SP Notes - used to compare the relationship between two variables where the relationship appears to be continuous (ie. BP & blood loss) - linear regression = drawing of a line that best describes the association between two variables - correlation = closeness of association between two continuous variables. Assumptions - relationship is linear observations are independent outcomes of interest are dependent on observations observations must be normally distributed LINEAR REGRESSION - data fed into computer - independent variables (x) vs dependent variables (y) - computer draws line of best fit through the points by choosing a course which minimises the sum of the squared vertical distances between the individual points (yi) and their imaginary equivalents (y) on the line = the least squares fit - the plot of y at x = the regression of y on x - equation that describes the line & proposed relationship: y = a + b.x y = predicted points on regression line b = slope of line (regression co-efficient), defines the proposed relationship a = intercept of y axis when x = 0 b > 0 - positive relationship b < 0 - negative relationship b = 0 - line of no slope -> no relationship - the larger the sample the closer b will be to the true effect in the population - the precision can be gauged by reporting b with SE & CI. CORRELLATION - Pearsons correlation co-efficient (r) is used to assess how likely the proposed relationship is - it is based on quantifying the residual scatter around the regression line. r = 0 - no association at all Jeremy Fernando (2011) r r r r = = = = 0.2 0.4 0.7 1.0 to to to or 0.4 - mild association 0.7 - moderate association 1.0 - strong association -1.0 - perfect correlation Calculation (1) assessment of amount of residual scatter around regression line (greater scatter > poorer correlation) (2) r = a ratio of variance r = square root of (regression SS / total SS) SS = regression line of sum of squares (3) complex equation! Spearman's rank correlation (rs) - non-parametric test for small samples (<10 patients) - variables are ranked separately - differences between the pairs of ranks for each patient is calculated, squared & summed. - the sum is used in Spearmans rank correlation equation to give rs which is interpreted in the same way as r. Jeremy Fernando (2011)


