Factoring Quadratics & Scatter Plots Presentation
advertisement
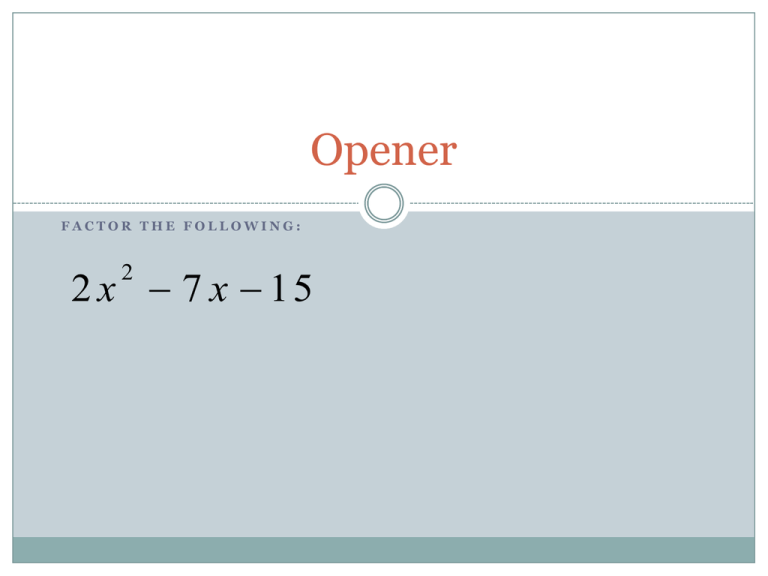
Opener FACTOR THE FOLLOWING: 2 x 7 x 15 2 2-5 Scatter Plots and Lines of Regression 1. Bivariate Data – data with two variables 2. Scatter Plot – graph of bivariate data. Used to predict. 3. Line of Best Fit – connect two points with equal points on either side. Then calculate the Prediction Equation. (y=mx+b) 4. Regression Line – calculation of line of best fit. 5. Correlation Coefficient - r measures how good the line of regression is. -1 < r < 1 Vocabulary Steps to Find your Line of Prediction 1. Plot Points and label axis. 2. Draw a line of best fit with the same number of points on each side. 3. Pick two points on the line and calculate an equation. (prediction equation) 4. Predict the number of households in 2020. Try Another 2nd catalog. Diagnostics on. Graphing Calculator Practice You Try!!! Use your Calculator.
