Module 1 Review Questions
advertisement
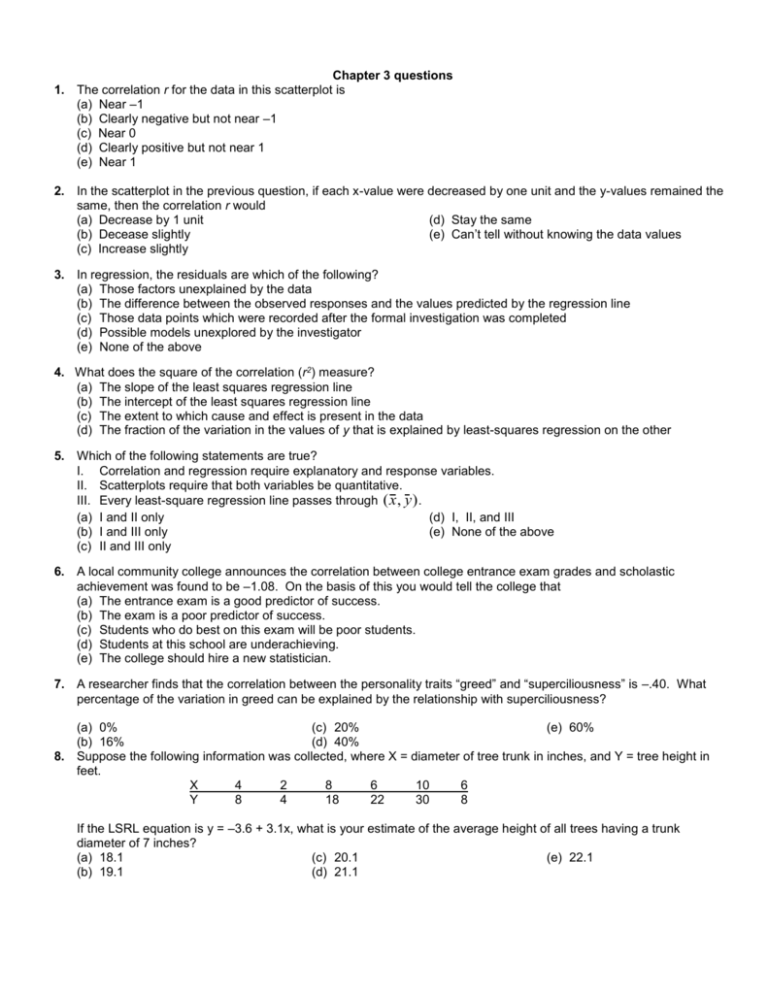
Chapter 3 questions 1. The correlation r for the data in this scatterplot is (a) Near –1 (b) Clearly negative but not near –1 (c) Near 0 (d) Clearly positive but not near 1 (e) Near 1 2. In the scatterplot in the previous question, if each x-value were decreased by one unit and the y-values remained the same, then the correlation r would (a) Decrease by 1 unit (d) Stay the same (b) Decease slightly (e) Can’t tell without knowing the data values (c) Increase slightly 3. In regression, the residuals are which of the following? (a) Those factors unexplained by the data (b) The difference between the observed responses and the values predicted by the regression line (c) Those data points which were recorded after the formal investigation was completed (d) Possible models unexplored by the investigator (e) None of the above 4. What does the square of the correlation (r2) measure? (a) The slope of the least squares regression line (b) The intercept of the least squares regression line (c) The extent to which cause and effect is present in the data (d) The fraction of the variation in the values of y that is explained by least-squares regression on the other 5. Which of the following statements are true? I. Correlation and regression require explanatory and response variables. II. Scatterplots require that both variables be quantitative. III. Every least-square regression line passes through (x , y ) . (a) I and II only (d) I, II, and III (b) I and III only (e) None of the above (c) II and III only 6. A local community college announces the correlation between college entrance exam grades and scholastic achievement was found to be –1.08. On the basis of this you would tell the college that (a) The entrance exam is a good predictor of success. (b) The exam is a poor predictor of success. (c) Students who do best on this exam will be poor students. (d) Students at this school are underachieving. (e) The college should hire a new statistician. 7. A researcher finds that the correlation between the personality traits “greed” and “superciliousness” is –.40. What percentage of the variation in greed can be explained by the relationship with superciliousness? (a) 0% (c) 20% (e) 60% (b) 16% (d) 40% 8. Suppose the following information was collected, where X = diameter of tree trunk in inches, and Y = tree height in feet. X 4 2 8 6 10 6 Y 8 4 18 22 30 8 If the LSRL equation is y = –3.6 + 3.1x, what is your estimate of the average height of all trees having a trunk diameter of 7 inches? (a) 18.1 (c) 20.1 (e) 22.1 (b) 19.1 (d) 21.1 9. Suppose we fit the least squares regression line to a set of data. What is true if a plot of the residuals shows a curved pattern? (a) A straight line is not a good model for the data. (b) The correlation must be 0. (c) The correlation must be positive. (d) Outliers must be present. (e) The LSRL might or might not be a good model for the data, depending on the extent of the curve. 10. The following are resistant: (a) Least squares regression line (b) Correlation coefficient (c) Both the least square line and the correlation coefficient (d) Neither the least square line nor the correlation coefficient (e) It depends. Answers: 1. b; 2. d; 3. b; 4. d; 5. d; 6. e; 7. b; 8. a; 9. a; 10. d
