Correlation and Regression in Excel
advertisement
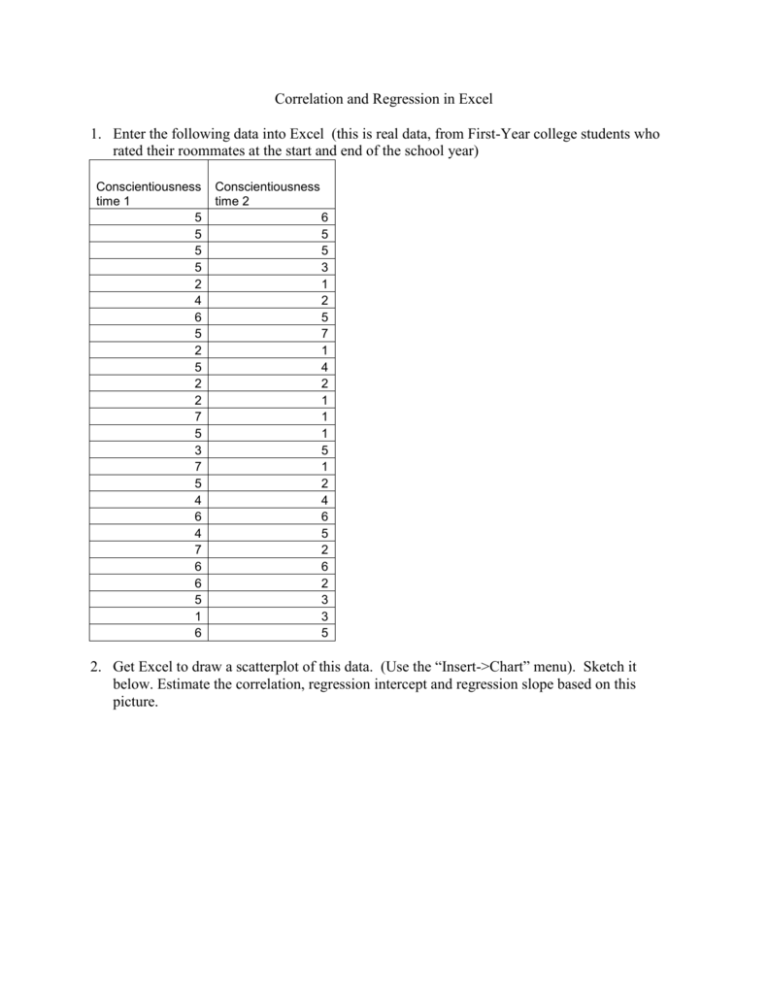
Correlation and Regression in Excel 1. Enter the following data into Excel (this is real data, from First-Year college students who rated their roommates at the start and end of the school year) Conscientiousness time 1 5 5 5 5 2 4 6 5 2 5 2 2 7 5 3 7 5 4 6 4 7 6 6 5 1 6 Conscientiousness time 2 6 5 5 3 1 2 5 7 1 4 2 1 1 1 5 1 2 4 6 5 2 6 2 3 3 5 2. Get Excel to draw a scatterplot of this data. (Use the “Insert->Chart” menu). Sketch it below. Estimate the correlation, regression intercept and regression slope based on this picture. 3. Calculate the correlation. r = ________ 4. Calculate the regression slope and intercept. Write the equation here: Y’ = ____ + ____ X 5. Copy the original data into a new worksheet. Using your regression equation, get a column of predicted values and a column of residuals. Create a scatterplot, plotting the residuals on the Y axis and the time 1 scores on the X axis. Sketch it below. 6. Fill in the regression ANOVA table below, based on calculations you do on the predicted values and residuals: Source SS df s2 F Model Error Total 7. Copy the original data into a new worksheet. Have Excel do a full regression analysis on it. Go “Data Analysis-> Regression. Input the X range and Y range. Check off the box that says “residual plot”. Do the answers match yours above?


