STAT303 Outline
advertisement
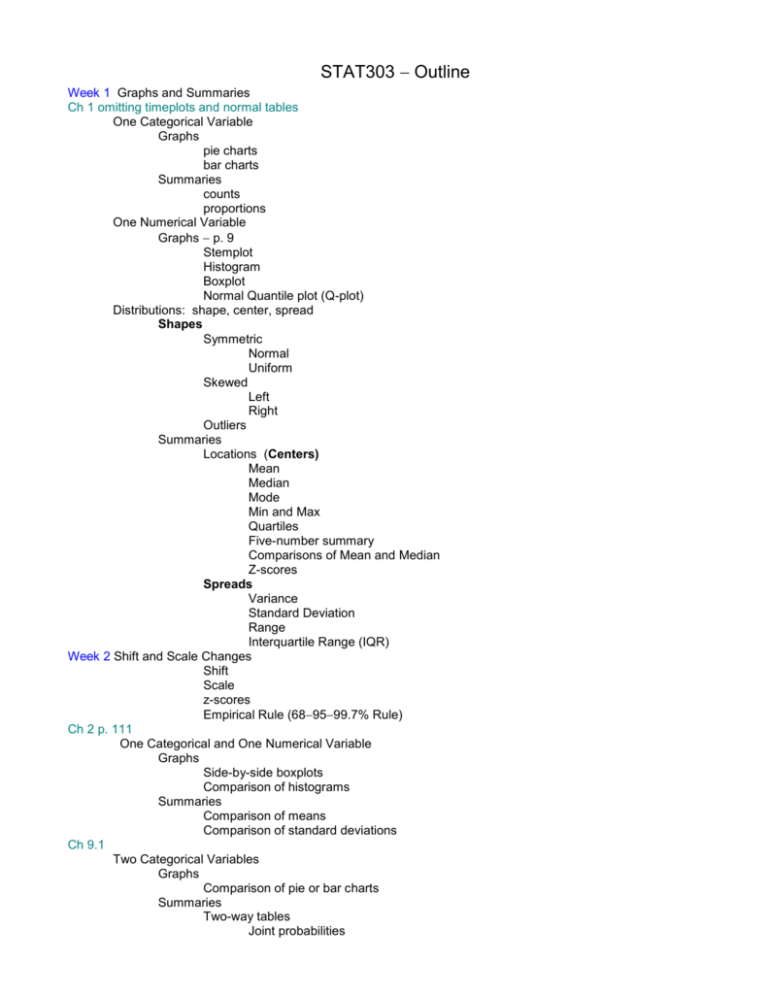
STAT303 Outline Week 1 Graphs and Summaries Ch 1 omitting timeplots and normal tables One Categorical Variable Graphs pie charts bar charts Summaries counts proportions One Numerical Variable Graphs p. 9 Stemplot Histogram Boxplot Normal Quantile plot (Q-plot) Distributions: shape, center, spread Shapes Symmetric Normal Uniform Skewed Left Right Outliers Summaries Locations (Centers) Mean Median Mode Min and Max Quartiles Five-number summary Comparisons of Mean and Median Z-scores Spreads Variance Standard Deviation Range Interquartile Range (IQR) Week 2 Shift and Scale Changes Shift Scale z-scores Empirical Rule (689599.7% Rule) Ch 2 p. 111 One Categorical and One Numerical Variable Graphs Side-by-side boxplots Comparison of histograms Summaries Comparison of means Comparison of standard deviations Ch 9.1 Two Categorical Variables Graphs Comparison of pie or bar charts Summaries Two-way tables Joint probabilities Marginal probabilities Conditional probabilities Ch 2 Two Numerical Variables Graphs Scatterplots Summaries Correlation Slope Intercept Week 3 Producing Data Ch 3 Observational Studies Experiments Randomization Matched pairs design Sampling Methods Simple random Samples Stratified samples Cluster samples Multistage samples Statistical inference Parameters Statistics Sampling variability Sampling distributuions Bias and variability Margin of error Week 4 Exam 1 Feb. 8th or 9th Probability and Random Variables Ch 4 and 1.3 = normals Probability Normal probabilities and inverse normals Random variables Means Variances Shift and scale changes Week 5 Sampling Distributions Ch 5 One Categorical Variable One Numerical Variable Week 6&7 Inference Ch 6 Confidence interval Confidence level Margin of error Sample size for desired margin of error Null hypothesis Alternative hypothesis Significance level Type I and II errors and power Test statistics Pvalues Statistical significance Week 8 Exam 2 Mar. 8th or 9th Week 9 Inference Ch 7.1 One Numeric Variable, unknown Assumptions Confidence interval Hypothesis test Ch 8.1 One Categorical Variable Approximate Z distribution Assumptions Confidence interval Hypothesis test Week 10 More Confidence Intervals and Hypothesis Testing Ch 7.2 One Categorical(two levels) and One Numerical Variable Distribution of the difference of two means Assumptions Confidence interval for the difference of two means Hypothesis testing for the difference of two means Ch 8.2 Two Categorical Variables (one with two levels) Distribution of the difference of two proportions Assumptions Confidence interval for the difference of two proportions Hypothesis testing for the difference of two proportions April 5th, Last day to Q-drop Week 11 Exam 3 Apr. 5th or 6th Week 12 Regressions Analysis Ch 2.4 and 10 Two Numerical Variables Simple Linear Regression Analysis Assumptions Residual plots ANOVA table Confidence intervals for the mean response Prediction intervals Week 13 More on LSR inference Week 14 Multiples Ch 9 2 Test for Independence Assumptions Test statistic and it’s pvalue Ch 12 Analysis of Variance Ftest Assumptions Test statistic and it’s pvalue Week 15 Review for Finals, May 5th thru 10th
