Grade 2 Mathematics Module 7, Topic A
New York State Common Core
2
G R A D E
Mathematics Curriculum
GRADE 2 • MODULE 7
Topic A
Problem Solving with Categorical
Data
2.MD.10, 2.MD.6
Focus Standard:
Instructional Days:
2.MD.10
Coherence -Links from: G1–M3
-Links to:
5
G3–M6
Draw a picture graph and a bar graph (with single-unit scale) to represent a data set with up to four categories. Solve simple put-together, take-apart, and compare problems using information presented in a bar graph.
Ordering and Comparing Length Measurements as Numbers
Collecting and Displaying Data
In Topic A, student work revolves around categorical data, which is produced by sorting objects or information into categories. For example, students learn about categories of animal classes and habitats and then record that data in a table. Students also learn to use picture graphs and bar graphs to organize and represent the data in as many as four categories (2.MD.10). They learn that this organizing of information makes it easier to compare data and can help them solve problems.
In Lesson 1, working within a science context, students categorize animals into classes (mammals, birds, fish, and reptiles), organize them in the form of a table, and then use the category counts to solve simple put-
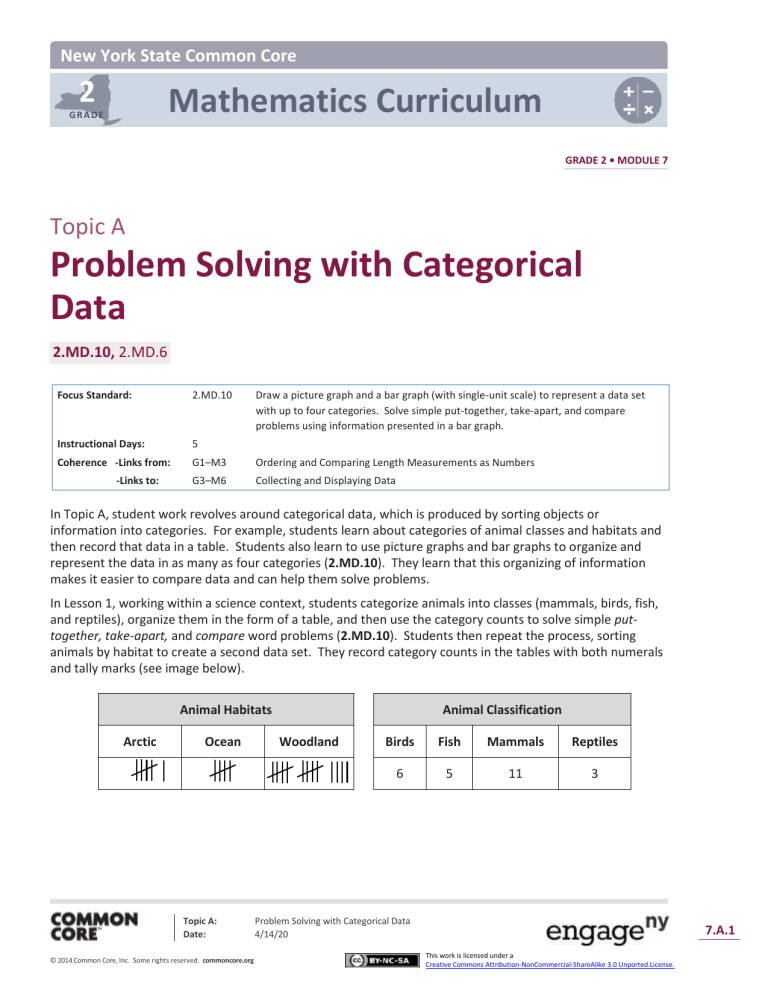
together, take-apart, and compare word problems (2.MD.10). Students then repeat the process, sorting animals by habitat to create a second data set. They record category counts in the tables with both numerals and tally marks (see image below).
Arctic
Animal Habitats
Ocean Woodland Birds
6
Animal Classification
Fish
5
Mammals
11
Reptiles
3
Topic A:
Date:
© 2014 Common Core, Inc. Some rights reserved. commoncore.org
Problem Solving with Categorical Data
4/14/20
This work is licensed under a
Creative Commons Attribution-NonCommercial-ShareAlike 3.0 Unported.License.
7.A.1
NYS COMMON CORE MATHEMATICS CURRICULUM
Topic A
2 7
In Lesson 2, students learn to draw and label a picture graph using the data from Lesson 1. Grid paper provides support as students construct these graphs. They learn that a graph can be oriented horizontally or vertically and that each picture represents one object.
1 Students ask and answer questions based on the information displayed in the graphs.
Following the same procedure and using the same data as in Lesson 2, students learn to draw and label a bar graph in
Lesson 3. They learn that one axis names the category, while the other shows a single-unit count scale. As students ask and answer questions based on the data in the graphs, they relate the count scale to finding sums and differences on a number line diagram. In Lesson 4, students continue working with bar graphs to represent new data sets and solve simple word problems.
Topic A culminates in Lesson 5 as students display money data in a bar graph and use this data to solve word problems. This leads into problem solving with coins in
Topic B.
A Teaching Sequence Toward Mastery of Problem Solving with Categorical Data
Objective 1: Sort and record data into a table using up to four categories; use category counts to solve word problems.
(Lesson 1)
Objective 2: Draw and label a picture graph to represent data with up to four categories.
(Lesson 2)
Objective 3: Draw and label a bar graph to represent data; relate the count scale to the number line.
(Lesson 3)
Objective 4: Draw a bar graph to represent a given data set.
(Lesson 4)
Objective 5: Solve word problems using data presented in a bar graph.
(Lesson 5)
1 Note that pictures can represent more than one object beginning in Grade 3.
Topic A:
Date:
© 2014 Common Core, Inc. Some rights reserved. commoncore.org
Problem Solving with Categorical Data
4/14/20
This work is licensed under a
Creative Commons Attribution-NonCommercial-ShareAlike 3.0 Unported.License.
7.A.2

