Week One: Data, Probability, and Significance & Hypothesis Testing
advertisement
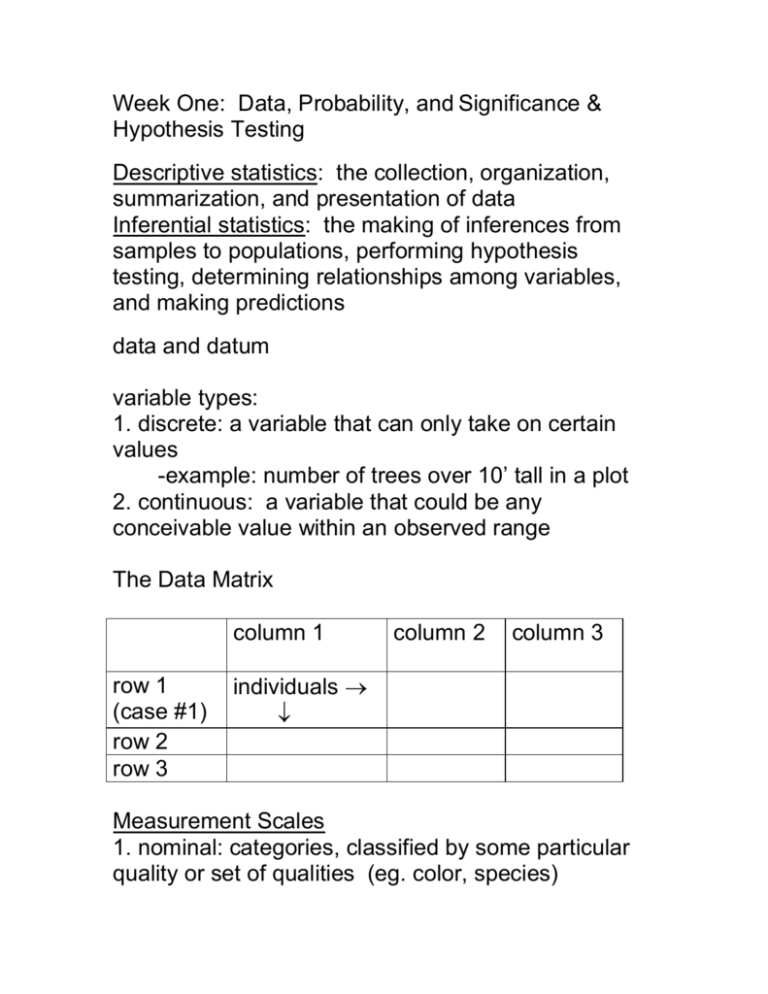
Week One: Data, Probability, and Significance & Hypothesis Testing Descriptive statistics: the collection, organization, summarization, and presentation of data Inferential statistics: the making of inferences from samples to populations, performing hypothesis testing, determining relationships among variables, and making predictions data and datum variable types: 1. discrete: a variable that can only take on certain values -example: number of trees over 10’ tall in a plot 2. continuous: a variable that could be any conceivable value within an observed range The Data Matrix column 1 row 1 (case #1) row 2 row 3 column 2 column 3 individuals Measurement Scales 1. nominal: categories, classified by some particular quality or set of qualities (eg. color, species) 2. ordinal: ranked or ordered quantitative comparisons are not possible faster, darker, taller, A-B-C-D 3. interval: possess a constant interval size but not a true zero 4. ratio -a constant size interval exists between any adjacent units of the measurement scale -a zero point exists on the measurement scale and that there is a physical significance to this zero. examples: lengths, numbers of items, weights, volumes, capacities (ml, gallons), rates (mph), and lengths of time Graphical Presentation of Data SCIENCE AND STATISTICS induction vs. deduction induction: after initial observations/experiments, the making of a generalization deduction: making a generalization, and then designing an experiment to test the hypothesis scientific law: hypothesis that has a very high probability of being correct theory: when consistent interrelationships are found among characteristics of a system which enable the formation of a formalized set of propositions that purport to explain the structure and function of a system. Examples: theory of relativity, theory of evolution, atomic theory, Big Bang theory, plate tectonics theory.


