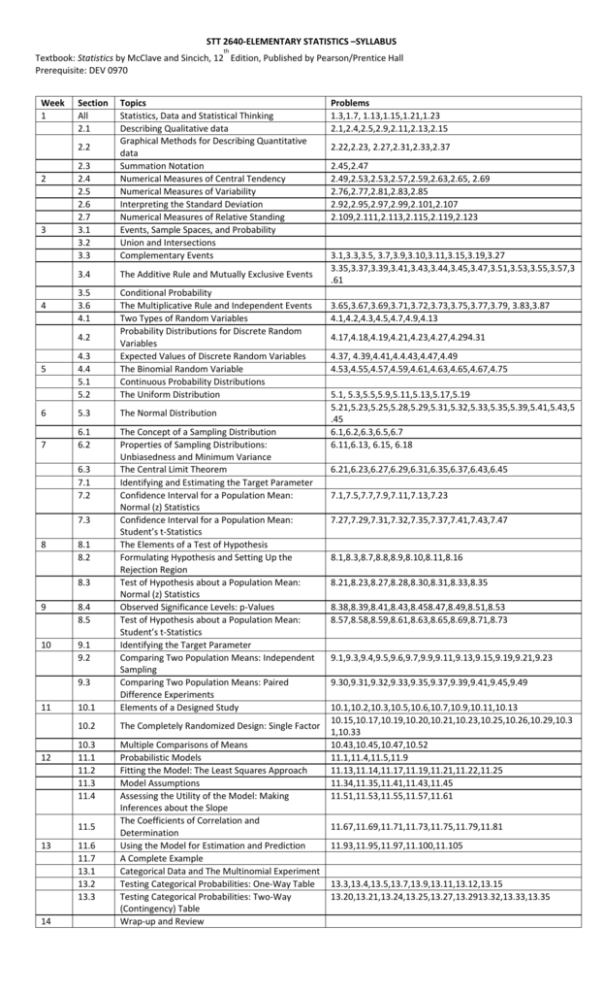
STT 2640‐ELEMENTARY STATISTICS –SYLLABUS th Textbook: Statistics by McClave and Sincich, 12 Edition, Published by Pearson/Prentice Hall Prerequisite: DEV 0970 Week Section Topics 1 All Statistics, Data and Statistical Thinking 2.1 Describing Qualitative data Graphical Methods for Describing Quantitative 2.2 data 2.3 Summation Notation 2 2.4 Numerical Measures of Central Tendency 2.5 Numerical Measures of Variability 2.6 Interpreting the Standard Deviation 2.7 Numerical Measures of Relative Standing 3 3.1 Events, Sample Spaces, and Probability 3.2 Union and Intersections 3.3 Complementary Events 3.4 The Additive Rule and Mutually Exclusive Events 4 3.5 3.6 4.1 5 4.3 4.4 5.1 5.2 Conditional Probability The Multiplicative Rule and Independent Events Two Types of Random Variables Probability Distributions for Discrete Random Variables Expected Values of Discrete Random Variables The Binomial Random Variable Continuous Probability Distributions The Uniform Distribution 6 5.3 The Normal Distribution 7 6.1 6.2 6.3 7.1 7.2 7.3 8 8.1 8.2 8.3 9 8.4 8.5 10 9.1 9.2 9.3 11 10.1 The Concept of a Sampling Distribution Properties of Sampling Distributions: Unbiasedness and Minimum Variance The Central Limit Theorem Identifying and Estimating the Target Parameter Confidence Interval for a Population Mean: Normal (z) Statistics Confidence Interval for a Population Mean: Student’s t‐Statistics The Elements of a Test of Hypothesis Formulating Hypothesis and Setting Up the Rejection Region Test of Hypothesis about a Population Mean: Normal (z) Statistics Observed Significance Levels: p‐Values Test of Hypothesis about a Population Mean: Student’s t‐Statistics Identifying the Target Parameter Comparing Two Population Means: Independent Sampling Comparing Two Population Means: Paired Difference Experiments Elements of a Designed Study 12 10.3 11.1 11.2 11.3 11.4 4.2 10.2 11.5 13 11.6 11.7 13.1 13.2 13.3 14 Problems 1.3,1.7, 1.13,1.15,1.21,1.23 2.1,2.4,2.5,2.9,2.11,2.13,2.15 2.22,2.23, 2.27,2.31,2.33,2.37 2.45,2.47 2.49,2.53,2.53,2.57,2.59,2.63,2.65, 2.69 2.76,2.77,2.81,2.83,2.85 2.92,2.95,2.97,2.99,2.101,2.107 2.109,2.111,2.113,2.115,2.119,2.123 3.1,3.3,3.5, 3.7,3.9,3.10,3.11,3.15,3.19,3.27 3.35,3.37,3.39,3.41,3.43,3.44,3.45,3.47,3.51,3.53,3.55,3.57,3
.61 3.65,3.67,3.69,3.71,3.72,3.73,3.75,3.77,3.79, 3.83,3.87 4.1,4.2,4.3,4.5,4.7,4.9,4.13 4.17,4.18,4.19,4.21,4.23,4.27,4.294.31 4.37, 4.39,4.41,4.4.43,4.47,4.49 4.53,4.55,4.57,4.59,4.61,4.63,4.65,4.67,4.75 5.1, 5.3,5.5,5.9,5.11,5.13,5.17,5.19 5.21,5.23,5.25,5.28,5.29,5.31,5.32,5.33,5.35,5.39,5.41,5.43,5
.45 6.1,6.2,6.3,6.5,6.7 6.11,6.13, 6.15, 6.18 6.21,6.23,6.27,6.29,6.31,6.35,6.37,6.43,6.45 7.1,7.5,7.7,7.9,7.11,7.13,7.23 7.27,7.29,7.31,7.32,7.35,7.37,7.41,7.43,7.47 8.1,8.3,8.7,8.8,8.9,8.10,8.11,8.16 8.21,8.23,8.27,8.28,8.30,8.31,8.33,8.35 8.38,8.39,8.41,8.43,8.458.47,8.49,8.51,8.53 8.57,8.58,8.59,8.61,8.63,8.65,8.69,8.71,8.73 9.1,9.3,9.4,9.5,9.6,9.7,9.9,9.11,9.13,9.15,9.19,9.21,9.23 9.30,9.31,9.32,9.33,9.35,9.37,9.39,9.41,9.45,9.49 10.1,10.2,10.3,10.5,10.6,10.7,10.9,10.11,10.13 10.15,10.17,10.19,10.20,10.21,10.23,10.25,10.26,10.29,10.3
The Completely Randomized Design: Single Factor 1,10.33 Multiple Comparisons of Means 10.43,10.45,10.47,10.52 Probabilistic Models 11.1,11.4,11.5,11.9 Fitting the Model: The Least Squares Approach 11.13,11.14,11.17,11.19,11.21,11.22,11.25 Model Assumptions 11.34,11.35,11.41,11.43,11.45 Assessing the Utility of the Model: Making 11.51,11.53,11.55,11.57,11.61 Inferences about the Slope The Coefficients of Correlation and 11.67,11.69,11.71,11.73,11.75,11.79,11.81 Determination Using the Model for Estimation and Prediction 11.93,11.95,11.97,11.100,11.105 A Complete Example Categorical Data and The Multinomial Experiment Testing Categorical Probabilities: One‐Way Table 13.3,13.4,13.5,13.7,13.9,13.11,13.12,13.15 Testing Categorical Probabilities: Two‐Way 13.20,13.21,13.24,13.25,13.27,13.2913.32,13.33,13.35 (Contingency) Table Wrap‐up and Review

