CONTROL CHARTS FOR STATISTICAL PROCESS CONTROL
advertisement
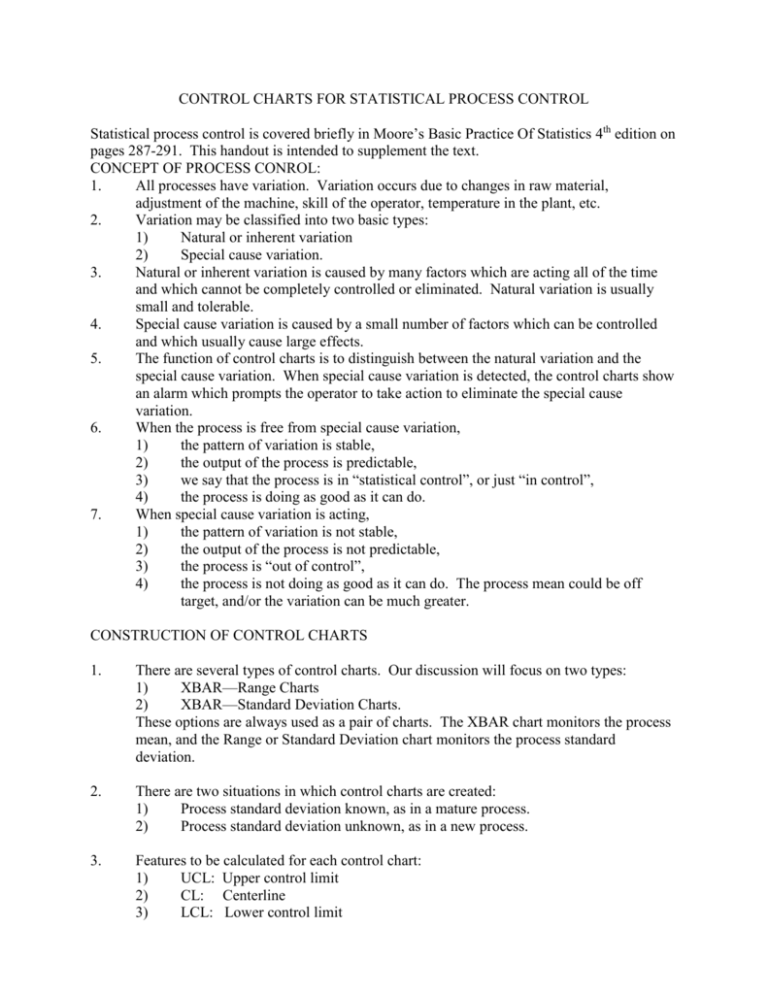
CONTROL CHARTS FOR STATISTICAL PROCESS CONTROL Statistical process control is covered briefly in Moore’s Basic Practice Of Statistics 4th edition on pages 287-291. This handout is intended to supplement the text. CONCEPT OF PROCESS CONROL: 1. All processes have variation. Variation occurs due to changes in raw material, adjustment of the machine, skill of the operator, temperature in the plant, etc. 2. Variation may be classified into two basic types: 1) Natural or inherent variation 2) Special cause variation. 3. Natural or inherent variation is caused by many factors which are acting all of the time and which cannot be completely controlled or eliminated. Natural variation is usually small and tolerable. 4. Special cause variation is caused by a small number of factors which can be controlled and which usually cause large effects. 5. The function of control charts is to distinguish between the natural variation and the special cause variation. When special cause variation is detected, the control charts show an alarm which prompts the operator to take action to eliminate the special cause variation. 6. When the process is free from special cause variation, 1) the pattern of variation is stable, 2) the output of the process is predictable, 3) we say that the process is in “statistical control”, or just “in control”, 4) the process is doing as good as it can do. 7. When special cause variation is acting, 1) the pattern of variation is not stable, 2) the output of the process is not predictable, 3) the process is “out of control”, 4) the process is not doing as good as it can do. The process mean could be off target, and/or the variation can be much greater. CONSTRUCTION OF CONTROL CHARTS 1. There are several types of control charts. Our discussion will focus on two types: 1) XBAR—Range Charts 2) XBAR—Standard Deviation Charts. These options are always used as a pair of charts. The XBAR chart monitors the process mean, and the Range or Standard Deviation chart monitors the process standard deviation. 2. There are two situations in which control charts are created: 1) Process standard deviation known, as in a mature process. 2) Process standard deviation unknown, as in a new process. 3. Features to be calculated for each control chart: 1) UCL: Upper control limit 2) CL: Centerline 3) LCL: Lower control limit 4. Formulas for UCL, CL and LCL: 1) For the XBAR chart the formulas place the UCL and the LCL at a distance of 3 standard deviations of the sample mean above and below the centerline. By using 3 sigma limits, a sample mean would very rarely occur which is outside these control limits when the process is operating “in control”. Thus, a point outside of these limits signals an “out of control” situation. 2) For the Range Chart or Standard Deviation Chart, the limits are established using multipliers which are meant to place the UCL and LCL so that the sample Range or sample Standard Deviation would rarely fall outside the limits when the process is “in control”. 3) The formulas to be used depend on whether the process standard deviation is known or unknown. The formulas are given at the bottom of the sheet titled “Factors For Computing Central Lines and 3 sigma limits for XBAR, S and R Charts”. 4) If the process standard deviation is known, use the formulas on the left side of the page. 5) If the process standard deviation is not known, use the formulas on the right side of the page. 6) In these formulas, the desired process mean is the “target value” that is applicable for the part being produced. This is always known. 7) The constants A, A2, A3, etc used in the formulas have values given in the table above the formulas, and the values depend on the sample size being used. The sample size must be held constant, and the interval between samples must be established by knowledge of the process variation. EXAMPLE 1, PROCESS SIGMA KNOWN, XBAR – R Assumptions: Target value = 100, XBAR CHART: OR XBAR – S CHART Process σ = 10, sample size = 5 UCL: Target + A σ = 100 + 1.342* 10 = 113.42 CL: Target = 100 LCL: Target - A σ = 100 – 1.342 * 10 = 86.58 RANGE CHART: UCL: CL: LCL: D2 * σ = d2 * σ = D1 * σ = STD DEV CHART: UCL: CL: LCL: B6 * σ = c4 * σ = B5 * σ = 4.918 * 10 = 49.18 2.326 * 10 = 23.26 0 * 10 = 0 1.964 * 10 = 19.64 .9400 * 10 = 9.4 0 * 10 = 0 EXAMPLE 2, PROCESS SIGMA NOT KNOWN, XBAR – RANGE CHART Assumptions: Target value = 100 , RBAR (from the run data) = 10, n = 5 The process would be adjusted until the XBAR values were centered on the target value of 100. The mean of the Range values, RBAR, is related to the unknown value of σ and is used in the formulas. XBAR CHART: UCL: Target + A2 * RBAR = 100 + .577 * 10 = 105.77 CL: Target = 100 LCL: Target - A2 * RBAR = 100 - .577 * 10 = 94.23 RANGE CHART: UCL: D4 * RBAR CL: RBAR LCL: D3 * RBAR EXAMPLE 3, PROCESS SIGMA NOT KNOWN, = = 0 2.114 * 10 = 21.14 = 10 * 10 = 0 XBAR – STD DEV CHART Assumptions: Target value = 100 , SBAR (from the run data ) = 10, n=5 The process would be adjusted until the XBAR values are centered on the target value of 100. The mean of the Std Dev values, SBAR, is related to the unknown value of σ and is used in the formulas. XBAR CHART: UCL: Target + A3 * SBAR = 100 + 1.427 * 10 = 114.27 CL: Target = 100 LCL: Target - A3 * SBAR = 100 - 1.427 * 10 = 85.73 STD DEV CHART: UCL: B4 * SBAR CL: SBAR LCL: B3 * SBAR = = 2.089 * 10 = 20.89 = 10 0 * 10 = 0 CONTROL CHART INTERPRETATION: There are three rules which are in general use in nearly all applications using control charts. If any one of these three rules provides an “out of control” signal, the process is to be stopped, and the problem is corrected. Often 100 % inspection of all the production since the previous OK sample is required. When the process is restarted, more frequent sampling might be done for a period of time. 1. 2. 3. A single point on any chart which falls outside the control limits is a signal that the process is “out of control”. A “run” of 9 consecutive points on the same side of the centerline on any chart is a signal that the process is “out of control”. A “trend” of 7 consecutive points ascending or seven consecutive points descending is a signal that the process is “out of control”
