Presentazione di PowerPoint
advertisement
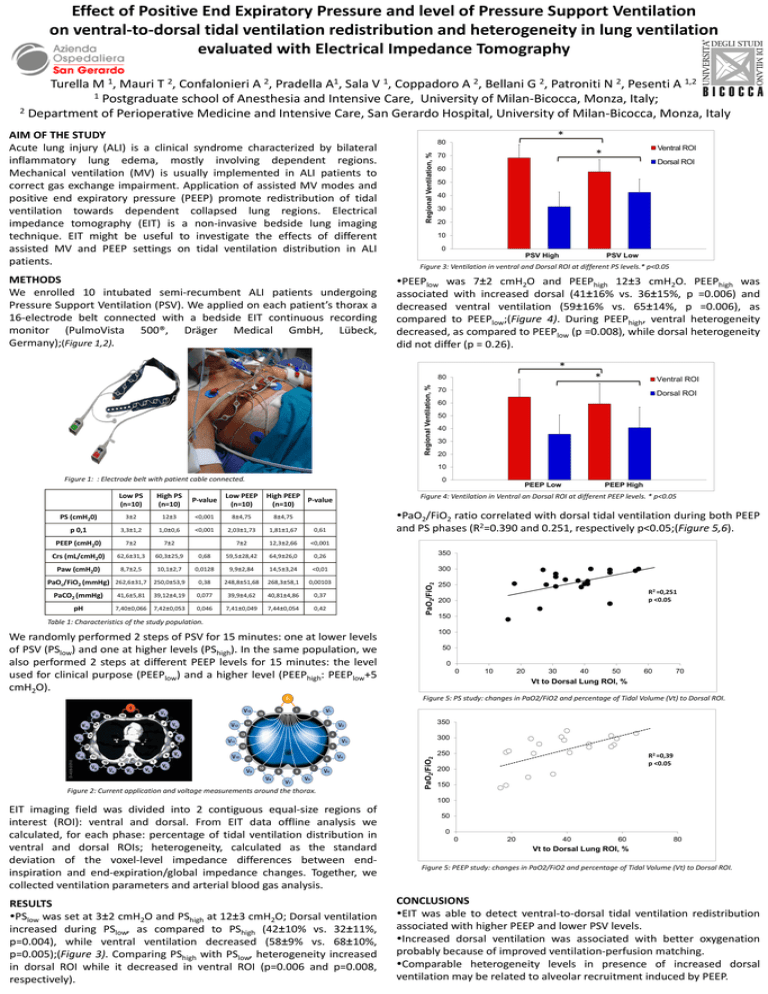
Effect of Positive End Expiratory Pressure and level of Pressure Support Ventilation on ventral-to-dorsal tidal ventilation redistribution and heterogeneity in lung ventilation evaluated with Electrical Impedance Tomography 1, 2, 2, 1 A, 1, 2, 2, 2, 1,2 Turella M Mauri T Confalonieri A Pradella Sala V Coppadoro A Bellani G Patroniti N Pesenti A 1 Postgraduate school of Anesthesia and Intensive Care, University of Milan-Bicocca, Monza, Italy; 2 Department of Perioperative Medicine and Intensive Care, San Gerardo Hospital, University of Milan-Bicocca, Monza, Italy METHODS We enrolled 10 intubated semi-recumbent ALI patients undergoing Pressure Support Ventilation (PSV). We applied on each patient’s thorax a 16-electrode belt connected with a bedside EIT continuous recording monitor (PulmoVista 500®, Dräger Medical GmbH, Lübeck, Germany);(Figure 1,2). * 80 Regional Ventilation, % AIM OF THE STUDY Acute lung injury (ALI) is a clinical syndrome characterized by bilateral inflammatory lung edema, mostly involving dependent regions. Mechanical ventilation (MV) is usually implemented in ALI patients to correct gas exchange impairment. Application of assisted MV modes and positive end expiratory pressure (PEEP) promote redistribution of tidal ventilation towards dependent collapsed lung regions. Electrical impedance tomography (EIT) is a non-invasive bedside lung imaging technique. EIT might be useful to investigate the effects of different assisted MV and PEEP settings on tidal ventilation distribution in ALI patients. Ventral ROI * 70 Dorsal ROI 60 50 40 30 20 10 0 1 PSV High PSV Low Figure 3: Ventilation in ventral and Dorsal ROI at different PS levels.* p<0.05 PEEPlow was 7±2 cmH2O and PEEPhigh 12±3 cmH2O. PEEPhigh was associated with increased dorsal (41±16% vs. 36±15%, p =0.006) and decreased ventral ventilation (59±16% vs. 65±14%, p =0.006), as compared to PEEPlow;(Figure 4). During PEEPhigh, ventral heterogeneity decreased, as compared to PEEPlow (p =0.008), while dorsal heterogeneity did not differ (p = 0.26). * * Regional Ventilation, % 80 Ventral ROI 70 Dorsal ROI 60 50 40 30 20 10 Figure 1: : Electrode belt with patient cable connected. 0 PEEP Low Low PS (n=10) High PS (n=10) P-value Low PEEP (n=10) PS (cmH20) 3±2 12±3 <0,001 8±4,75 8±4,75 p 0,1 3,3±1,2 1,0±0,6 <0,001 2,03±1,73 1,81±1,67 0,61 PEEP (cmH20) 7±2 7±2 7±2 12,3±2,66 <0,001 Crs (mL/cmH20) 62,6±31,3 60,3±25,9 0,68 59,5±28,42 64,9±26,0 0,26 Paw (cmH20) 8,7±2,5 10,1±2,7 0,0128 9,9±2,84 14,5±3,24 <0,01 300 0,38 248,8±51,68 268,3±58,1 0,00103 250 PaCO2 (mmHg) 41,6±5,81 39,12±4,19 0,077 39,9±4,62 40,81±4,86 0,37 pH 7,40±0,066 7,42±0,053 0,046 7,41±0,049 7,44±0,054 0,42 PEEP High Figure 4: Ventilation in Ventral an Dorsal ROI at different PEEP levels. * p<0.05 PaO2/FiO2 ratio correlated with dorsal tidal ventilation during both PEEP and PS phases (R2=0.390 and 0.251, respectively p<0.05;(Figure 5,6). 350 PaO2/FiO2 PaOc/FiO2 (mmHg) 262,6±31,7 250,0±53,9 High PEEP P-value (n=10) 1 Table 1: Characteristics of the study population. R2 =0,251 p <0.05 200 150 100 We randomly performed 2 steps of PSV for 15 minutes: one at lower levels of PSV (PSlow) and one at higher levels (PShigh). In the same population, we also performed 2 steps at different PEEP levels for 15 minutes: the level used for clinical purpose (PEEPlow) and a higher level (PEEPhigh: PEEPlow+5 cmH2O). 50 0 0 10 20 30 40 50 60 70 Vt to Dorsal Lung ROI, % Figure 5: PS study: changes in PaO2/FiO2 and percentage of Tidal Volume (Vt) to Dorsal ROI. 350 Figure 2: Current application and voltage measurements around the thorax. PaO2/FiO2 300 250 R2 =0,39 p <0.05 200 150 100 EIT imaging field was divided into 2 contiguous equal-size regions of interest (ROI): ventral and dorsal. From EIT data offline analysis we calculated, for each phase: percentage of tidal ventilation distribution in ventral and dorsal ROIs; heterogeneity, calculated as the standard deviation of the voxel-level impedance differences between endinspiration and end-expiration/global impedance changes. Together, we collected ventilation parameters and arterial blood gas analysis. RESULTS PSlow was set at 3±2 cmH2O and PShigh at 12±3 cmH2O; Dorsal ventilation increased during PSlow, as compared to PShigh (42±10% vs. 32±11%, p=0.004), while ventral ventilation decreased (58±9% vs. 68±10%, p=0.005);(Figure 3). Comparing PShigh with PSlow, heterogeneity increased in dorsal ROI while it decreased in ventral ROI (p=0.006 and p=0.008, respectively). 50 0 0 20 40 60 80 Vt to Dorsal Lung ROI, % Figure 5: PEEP study: changes in PaO2/FiO2 and percentage of Tidal Volume (Vt) to Dorsal ROI. CONCLUSIONS EIT was able to detect ventral-to-dorsal tidal ventilation redistribution associated with higher PEEP and lower PSV levels. Increased dorsal ventilation was associated with better oxygenation probably because of improved ventilation-perfusion matching. Comparable heterogeneity levels in presence of increased dorsal ventilation may be related to alveolar recruitment induced by PEEP.
