EMERSON ELECTRIC NYSE-EMR
TIMELINESS
SAFETY
TECHNICAL
–
1
–
Suspended 7/1/16
New 7/27/90
Suspended 7/1/16
BETA 1.10 (1.00 = Market)
2019-21 PROJECTIONS
High:
Low:
38.9
30.3
RECENT
PRICE
45.2
36.8
59.1
41.3
58.7
29.3
17.4 RELATIVE
DIV’D
Median: 17.0) P/E RATIO 0.91 YLD 3.7%
51.22 P/ERATIO 16.6(Trailing:
43.7
24.4
58.7
41.2
64.6
39.5
53.8
43.6
70.7
53.1
70.3
57.8
62.8
42.2
56.8
41.3
VALUE
LINE
Target Price Range
2019 2020 2021
LEGENDS
15.0 x ″Cash Flow″ p sh
. . . . Relative Price Strength
2-for-1 split 12/06
Options: Yes
Shaded area indicates recession
128
96
80
64
48
40
32
24
Ann’l Total
Price
Gain
Return
High
80 (+55%) 15%
Low
65 (+25%) 10%
Insider Decisions
to Buy
Options
to Sell
N
0
1
0
D
0
0
0
J
0
0
0
F
0
9
0
M
0
0
0
A
0
0
0
M
0
0
0
J
0
0
0
J
0
0
0
16
12
% TOT. RETURN 8/16
Institutional Decisions
4Q2015
1Q2016
2Q2016
497
572
548
to Buy
to Sell
625
543
535
Hld’s(000) 460916 457486 448218
Percent
shares
traded
12
8
4
1 yr.
3 yr.
5 yr.
2000 2001 2002 2003 2004 2005 2006 2007 2008 2009 2010 2011 2012 2013 2014 2015 2016 2017
18.18 18.44 16.43 16.57 18.61 21.07 25.02 28.63 32.17 27.82 27.95 32.78 33.71 34.91
2.46
2.07
1.90
1.84
2.16
2.49
3.05
3.54
4.10
3.26
3.71
4.49
3.85
4.80
1.65
1.20
1.26
1.21
1.49
1.78
2.24
2.66
3.11
2.27
2.60
3.24
2.67
3.54
.72
.77
.78
.79
.80
.83
.89
1.05
1.20
1.33
1.34
1.38
1.60
1.66
.81
.66
.46
.40
.48
.63
.75
.86
.93
.71
.70
.88
.92
.96
7.49
7.29
6.82
7.67
8.63
9.01 10.13 11.13 11.82 11.38 13.01 14.07 14.22 14.98
854.95 839.25 841.42 842.31 838.86 821.30 804.69 788.43 771.22 751.87 752.69 738.88 724.11 706.66
17.5
27.2
21.4
20.9
20.5
18.7
17.8
17.1
16.6
14.8
17.8
16.8
18.3
15.8
1.14
1.39
1.17
1.19
1.08
1.00
.96
.91
1.00
.99
1.13
1.05
1.16
.89
2.5%
2.3%
2.9%
3.1%
2.6%
2.5%
2.2%
2.3%
2.3%
3.9%
2.9%
2.5%
3.3%
3.0%
CAPITAL STRUCTURE as of 6/30/16
Total Debt $7282 mill. Due in 5 Yrs $1715 mill.
LT Debt $4062 mill.
LT Interest $170.0 mill.
(Tot. int. coverage: 18.6x)
(34% of Cap’l)
Leases, Uncapitalized $263 mill.
Pension Assets-9/15 $4.86 bill. Oblig. $5.51 bill.
Pfd Stock None
Common Stock 643,537,433 shs.
as of 7/31/16
MARKET CAP: $33.0 billion (Large Cap)
CURRENT POSITION 2014
2015 6/30/16
($MILL.)
Cash Assets
3149
3054
3516
Receivables
5019
4319
4014
Inventory (Avg Cst) 2057
1847
1949
Other
642
829
741
Current Assets
10867 10049 10220
Accts Payable
2951
2358
2230
Debt Due
2465
2553
3220
Other
3038
2889
2876
Current Liab.
8454
7800
8326
20133
18.3%
607.0
1845.0
31.3%
9.2%
1956.0
3128.0
8154.0
17.1%
22.6%
13.7%
40%
22572
18.5%
656.0
2136.0
31.3%
9.5%
2519.0
3372.0
8772.0
18.3%
24.4%
14.8%
39%
24807
19.3%
707.0
2454.0
31.7%
9.9%
2758.0
3297.0
9113.0
20.5%
26.9%
16.6%
38%
20915
18.6%
727.0
1724.0
28.7%
8.2%
2697.0
3998.0
8555.0
14.7%
20.2%
8.5%
58%
21039 24222 24412 24669
20.6% 21.0% 17.7% 17.4%
816.0 867.0 823.0 819.0
1978.0 2454.0 1968.0 2570.5
29.5% 31.0% 35.0% 30.0%
9.4% 10.1%
8.1% 10.4%
2514.0 2880.0 2993.0 3374.0
4586.0 4324.0 3787.0 4055.0
9792.0 10399 10295 10585
14.7% 17.5% 14.8% 18.3%
20.2% 23.6% 19.1% 24.3%
9.9% 13.6%
7.7% 13.1%
51%
42%
60%
46%
THIS
STOCK
VL ARITH.*
INDEX
14.7
-3.9
32.5
10.9
29.8
84.5
© VALUE LINE PUB. LLC
19-21
35.22 34.07 31.70 33.05
4.01
4.47
4.30
4.55
3.75
3.17
3.00
3.20
1.72
1.88
1.90
1.94
1.10
1.05
1.00
1.00
14.53 12.34 11.90 12.10
696.61 654.61 640.00 635.00
17.6
18.0 Bold figures are
Value Line
.93
.91
estimates
2.6%
3.3%
Sales per sh A
‘‘Cash Flow’’ per sh
Earnings per sh AB
Div’ds Decl’d per sh C■
Cap’l Spending per sh
Book Value per sh D
Common Shs Outst’g E
Avg Ann’l P/E Ratio
Relative P/E Ratio
Avg Ann’l Div’d Yield
37.10
5.40
3.95
2.10
1.20
14.25
620.00
18.0
1.15
3.0%
24537
21.5%
823.0
1968.0
35.0%
8.0%
2413.0
3559.0
10119
15.2%
19.4%
7.5%
61%
Sales ($mill) A
Operating Margin
Depreciation ($mill)
Net Profit ($mill)
Income Tax Rate
Net Profit Margin
Working Cap’l ($mill)
Long-Term Debt ($mill)
Shr. Equity ($mill)
Return on Total Cap’l
Return on Shr. Equity
Retained to Com Eq
All Div’ds to Net Prof
23000
21.5%
850
2495
35.0%
10.8%
2650
4000
8850
20.0%
28.0%
13.5%
52%
22304
21.0%
815.0
2109.0
32.8%
9.5%
2249.0
4289.0
8081.0
17.7%
26.1%
10.4%
60%
20300
19.5%
800
1945
31.5%
9.6%
1500
4240
7610
17.5%
25.5%
9.5%
63%
21000
20.5%
810
2070
35.0%
9.9%
1600
4190
7695
18.5%
27.0%
11.0%
60%
BUSINESS: Emerson Electric Company designs and manufactures
a broad range of electrical and electronic products and systems for
the commercial, industrial, and consumer markets. Operating segments include: Process Management (in 2015, provided 37% of
revenues, 44% of earnings), Industrial Automation (18%, 18%),
Network Power (19%, 7%), Climate Technologies (17%, 20%), and
Commercial & Residential Solutions (9%, 11%). In 2015, international sales were 52% of total; Research & Development, 2.2% of
sales. Has about 110,800 employees. Officers and directors own
.8% of stock (12/15 Proxy). Chairman & CEO: David N. Farr. Incorporated: MO. Address: 8000 W. Florissant Avenue, St. Louis,
MO 63136. Telephone: 314-553-2000. Internet: www.emerson.com.
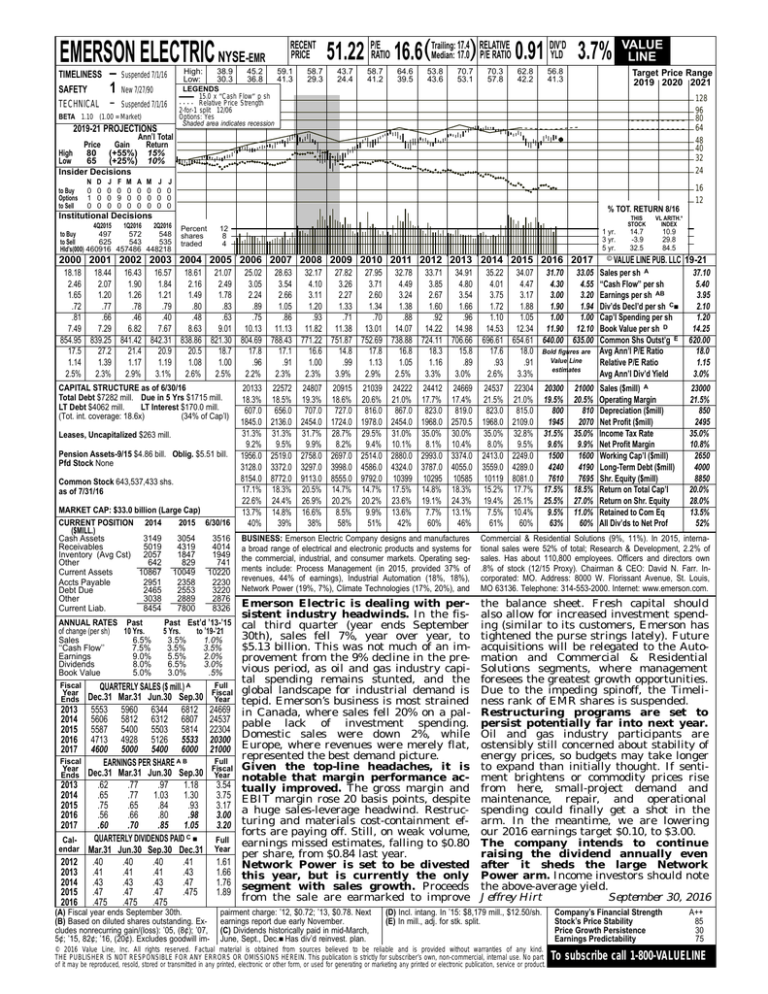
Emerson Electric is dealing with persistent industry headwinds. In the fisANNUAL RATES Past
Past Est’d ’13-’15 cal third quarter (year ends September
of change (per sh)
10 Yrs.
5 Yrs.
to ’19-’21
30th), sales fell 7%, year over year, to
Sales
6.5%
3.5%
1.0%
$5.13 billion. This was not much of an im‘‘Cash Flow’’
7.5%
3.5%
3.5%
Earnings
9.0%
5.5%
2.0%
provement from the 9% decline in the preDividends
8.0%
6.5%
3.0%
vious period, as oil and gas industry capiBook Value
5.0%
3.0%
.5%
tal spending remains stunted, and the
Fiscal
Full
QUARTERLY SALES ($ mill.) A
Year
Fiscal global landscape for industrial demand is
Dec.31
Mar.31
Jun.30
Sep.30
Ends
Year tepid. Emerson’s business is most strained
2013 5553 5960 6344 6812 24669 in Canada, where sales fell 20% on a pal2014 5606 5812 6312 6807 24537 pable lack of investment spending.
2015 5587 5400 5503 5814 22304 Domestic sales were down 2%, while
2016 4713 4928 5126 5533 20300
2017 4600 5000 5400 6000 21000 Europe, where revenues were merely flat,
represented the best demand picture.
Fiscal
Full
EARNINGS PER SHARE A B
Year
Fiscal Given the top-line headaches, it is
Dec.31
Mar.31
Jun.30
Sep.30
Ends
Year notable that margin performance ac2013
.62
.77
.97
1.18
3.54 tually improved. The gross margin and
2014
.65
.77
1.03
1.30
3.75 EBIT margin rose 20 basis points, despite
2015
.75
.65
.84
.93
3.17
2016
.56
.66
.80
.98
3.00 a huge sales-leverage headwind. Restruc2017
.60
.70
.85
1.05
3.20 turing and materials cost-containment efforts are paying off. Still, on weak volume,
C■
QUARTERLY
DIVIDENDS
PAID
CalFull earnings missed estimates, falling to $0.80
endar Mar.31 Jun.30 Sep.30 Dec.31 Year
per share, from $0.84 last year.
2012 .40
.40
.40
.41
1.61 Network Power is set to be divested
2013 .41
.41
.41
.43
1.66 this year, but is currently the only
2014 .43
.43
.43
.47
1.76 segment with sales growth. Proceeds
2015 .47
.47
.47
.475
1.89
from the sale are earmarked to improve
2016 .475
.475
.475
the balance sheet. Fresh capital should
also allow for increased investment spending (similar to its customers, Emerson has
tightened the purse strings lately). Future
acquisitions will be relegated to the Automation and Commercial & Residential
Solutions segments, where management
foresees the greatest growth opportunities.
Due to the impeding spinoff, the Timeliness rank of EMR shares is suspended.
Restructuring programs are set to
persist potentially far into next year.
Oil and gas industry participants are
ostensibly still concerned about stability of
energy prices, so budgets may take longer
to expand than initially thought. If sentiment brightens or commodity prices rise
from here, small-project demand and
maintenance, repair, and operational
spending could finally get a shot in the
arm. In the meantime, we are lowering
our 2016 earnings target $0.10, to $3.00.
The company intends to continue
raising the dividend annually even
after it sheds the large Network
Power arm. Income investors should note
the above-average yield.
Jeffrey Hirt
September 30, 2016
(A) Fiscal year ends September 30th.
(B) Based on diluted shares outstanding. Excludes nonrecurring gain/(loss): ’05, (8¢); ’07,
5¢; ’15, 82¢; ’16, (20¢). Excludes goodwill im-
pairment charge: ’12, $0.72; ’13, $0.78. Next
earnings report due early November.
(C) Dividends historically paid in mid-March,
June, Sept., Dec.■ Has div’d reinvest. plan.
(D) Incl. intang. In ’15: $8,179 mill., $12.50/sh.
(E) In mill., adj. for stk. split.
© 2016 Value Line, Inc. All rights reserved. Factual material is obtained from sources believed to be reliable and is provided without warranties of any kind.
THE PUBLISHER IS NOT RESPONSIBLE FOR ANY ERRORS OR OMISSIONS HEREIN. This publication is strictly for subscriber’s own, non-commercial, internal use. No part
of it may be reproduced, resold, stored or transmitted in any printed, electronic or other form, or used for generating or marketing any printed or electronic publication, service or product.
Company’s Financial Strength
Stock’s Price Stability
Price Growth Persistence
Earnings Predictability
A++
85
30
75
To subscribe call 1-800-VALUELINE


