BHP BILLITON LTD. (ADR)
TIMELINESS
SAFETY
TECHNICAL
3
3
4
High:
Low:
Raised 7/8/16
34.5
22.6
RECENT
NYSE-BHP PRICE
50.7
33.2
87.4
36.4
95.6
24.5
NMF RELATIVE
DIV’D
Median: 14.0) P/E RATIO 1.06 YLD 3.0%
27.33 P/ERATIO 18.6(Trailing:
78.8
33.1
93.6
58.4
104.6
62.5
82.2
59.9
80.5
55.7
73.9
44.9
53.0
23.2
33.0
18.5
Target Price Range
2019 2020 2021
LEGENDS
7.0 x ″Cash Flow″p ADR
. . . . Relative Price Strength
Options: Yes
Shaded area indicates recession
Lowered 1/31/97
Lowered 7/1/16
BETA 1.35 (1.00 = Market)
VALUE
LINE
128
96
80
64
48
40
32
24
2019-21 PROJECTIONS
Ann’l Total
Price
Gain
Return
High
50 (+85%) 19%
Low
30 (+10%)
7%
Insider Decisions
16
12
NOT REPORTED
% TOT. RETURN 5/16
U.S. Institutional Decisions
3Q2015
151
to Buy
to Sell
215
Hld’s(000) 50571
4Q2015
116
214
48335
1Q2016
135
141
48496
Percent
shares
traded
12
8
4
1 yr.
3 yr.
5 yr.
2000 2001 2002 2003 2004 2005 2006 2007 2008 2009 2010 2011 2012 2013 2014 2015 2016 2017
.60
.51
------------6.45
5.70
4.86
5.02
7.35
9.77 10.78 13.80 21.28 18.05 18.98 26.96 27.14 24.79
1.34
1.11
1.12
1.09
1.47
2.80
4.26
5.53
6.80
3.50
6.28 10.78
8.20
6.70
.65
.45
.50
.50
.86
2.08
3.46
4.59
5.51
2.11
4.56
8.54
5.77
4.07
.30
.26
.26
.29
.33
.46
.64
.77
1.12
1.64
1.66
1.82
2.20
2.28
.32
-.78
.78
.72
1.11
1.76
2.22
2.70
3.41
3.35
4.19
6.91
8.11
3.36
3.10
5.67
5.42
6.04
7.27
8.20 10.45 13.97 14.63 17.44 21.33 24.75 26.55
1839.4 1852.0 3022.0 3108.0 3113.8 3028.6 2982.0 2862.0 2794.7 2782.2 2782.2 2661.3 2661.4 2661.3
16.9
23.2
22.0
21.9
19.0
11.3
10.3
9.6
13.3
23.4
15.4
10.0
13.0
17.2
1.10
1.19
1.20
1.25
1.00
.60
.56
.51
.80
1.56
.98
.63
.83
.97
2.7%
2.5%
2.4%
2.7%
2.0%
2.0%
1.8%
1.7%
1.5%
3.3%
2.4%
2.1%
2.9%
3.3%
CAPITAL STRUCTURE as of 12/31/15
32153 39498 59473 50211 52798 71739 72226 65968
Total Debt $36547 mill. Due in 5 Yrs $13071 mill.
37.4% 39.4% 45.6% 30.8% 46.0% 50.6% 40.5% 33.4%
LT Debt. $32476 mill. LT Interest $1500 mill.
2264.0 2421.0 3612.0 3871.0 4759.0 5039.0 6408.0 6945.0
(Total interest coverage: 14.1x)
(37% of Cap’l)
10450 13416 15390 5877.0 12722 23648 15417 10876
Leases, Uncapitalized Annual rentals $606.0 mill.
25.6% 25.1% 32.0% 45.4% 33.5% 23.4% 32.5% 38.0%
32.5% 34.0% 25.9% 11.7% 24.1% 33.0% 21.3% 16.5%
Pfd Stock None
d85.0 838.0 5202.0 10636 12092 5547.0 d1583 d586.0
Common Stock 5,321,185,791 shares (equivalent
7648.0
9291.0 9234.0 15325 13573 12388 24799 29862
to 2,660,592,895 ADRs).E
24455 29918 39043 40711 48525 56762 65870 70664
As of 6/30/15
33.6% 35.0% 32.6% 11.0% 20.9% 34.6% 17.4% 11.5%
MARKET CAP: $72.7 billion (Large Cap)
42.7% 44.8% 39.4% 14.4% 26.2% 41.7% 23.4% 15.4%
CURRENT POSITION 2014
2015 12/31/15
34.0% 37.3% 31.4%
3.2% 16.7% 32.8% 14.5%
6.7%
($MILL.)
Cash Assets
8803
6753 10626
20%
17%
20%
78%
36%
21%
38%
57%
Receivables
Inventory (Avg Cst)
Other
Current Assets
Accts Payable
Debt Due
Other
Current Liab.
6741
6013
739.0
22296
10145
4262
3657
18064
ANNUAL RATES Past
of change (per ADR) 10 Yrs.
Sales
11.5%
‘‘Cash Flow’’
14.0%
Earnings
12.0%
Dividends
21.0%
Book Value
15.5%
Fiscal
Year
Ends
2013
2014
2015
2016
2017
Fiscal
Year
Ends
2013
2014
2015
2016
2017
Calendar
2012
2013
2014
2015
2016
4321
4292
1003
16369
7389
3201
2263
12853
2903
3914
940
18383
5678
4071
1889
11638
Past Est’d ’13-’15
5 Yrs.
to ’19-’21
3.0%
-2.0%
3.5%
--3.0%
-5.5%
10.0%
-7.5%
12.0%
-2.0%
QUARTERLY SALES ($ mill.) B
Sep.30 Dec.31 Mar.31 Jun.30
- - 32204
- - 33764
- - 33948
- - 33258
- - 29900
- - 14736
- - 15712
- - 16288
- - 17000
- - 18000
EARNINGS PER ADR B C
Sep.30 Dec.31 Mar.31 Jun.30
-1.59 - 2.48
-3.04 - 2.14
-1.60 - d.29
-d2.12 - .72
-.75 - .75
GROSS Q’TRLY DIVIDENDS PAID D■
Mar.31 Jun.30 Sep.30 Dec.31
1.10 - 1.14 - 1.14 - 1.18 - 1.18 - 1.24 - 1.24 - 1.24 - .32 - -
Full
Fiscal
Year
65968
67206
44636
32000
35000
Full
Fiscal
Year
4.07
5.18
1.31
d1.40
1.50
(A) At fiscal yearend. (B) Year ends June 30.
(C) Based on U.S. GAAP. IFRS used in ’06
and ’07. Excl. nonrecurring items: ’00, (45¢);
’02, (9¢). Egs. reported semi-annually after ’03.
Full
Year
2.24
2.32
2.42
2.48
-25.26
8.47
5.18
2.36
6.01
29.75
2660.6
13.0
.68
3.5%
67206
43.7%
8701.0
13832
31.5%
20.6%
4232.0
30327
79143
13.2%
17.5%
9.4%
46%
---16.78 12.05 13.15
4.75
1.65
4.60
1.31 d1.40
1.50
2.48
1.56
.82
4.49
2.65
2.00
24.34 21.05 21.80
2660.6 2660.0 2660.0
41.5 Bold figures are
Value Line
2.10
estimates
4.6%
44636 32000 35000
37.6% 15.0% 38.0%
9158.0
8200
8300
3483.0 d3800
4000
45.5% 35.0% 35.0%
7.8%
NMF 11.4%
3516.0
5000
6000
27969 34000 34000
64768 56000 58000
4.1%
NMF
5.0%
5.4%
NMF
7.0%
NMF
NMF
3.5%
NMF
NMF
55%
THIS
STOCK
VL ARITH.*
INDEX
-36.6
-53.1
-65.9
-3.3
25.5
51.1
© VALUE LINE PUB. LLC
Trans. Rate (US$/A$) A F
Sales per ADR B
‘‘Cash Flow’’ per ADR
Earnings per ADR B C
Gross Div’ds Decl’d ADR
Cap’l Spending per ADR
Book Value per ADR
Equiv ADRs Outst’g E
Avg Ann’l P/E Ratio
Relative P/E Ratio
Avg Ann’l Div’d Yield
Sales ($mill) B
Operating Margin
Depreciation ($mill)
Net Profit ($mill)
Income Tax Rate
Net Profit Margin
Working Cap’l ($mill)
Long-Term Debt ($mill)
Shr. Equity ($mill)
Return on Total Cap’l
Return on Shr. Equity
Retained to Com Eq
All Div’ds to Net Prof
19-21
-20.00
6.60
2.50
D■ 1.50
4.00
23.85
2600.0
16.0
1.00
3.8%
52000
40.0%
11200
6000
35.0%
11.5%
9000
35000
62000
7.0%
9.5%
3.5%
60%
BUSINESS: BHP Billiton Ltd. (Formerly BHP. Merger with Billiton
Plc. completed 6-29-01) produces a variety of commodities, including crude oil, natural gas, iron ore, nickel, copper, diamonds, coal,
minerals, and steel. The company operates in Australia, as well as
several other countries, including Chile, South Africa, and the
United Kingdom. 2015 production: oil, 98.6 million barrels.; natural
gas, 786.6 bcf; copper, 1,708,300 tonnes; Alumina, 4.3 mill. tonnes.
Reserves as of 6/30/15: oil, 524.3 million barrels; natural gas, 7,190
bill. cubic ft. Has about 29,670 employees. Chairman: Jac Nasser.
CEO: Andrew Mackenzie. Inc.: Australia. Address: BHP Billiton
Center, 171 Collins St., Melbourne, Victoria 3000, Australia. U.S.
Tel.: 713-961-8500. Internet: www.bhpbilliton.com.au.
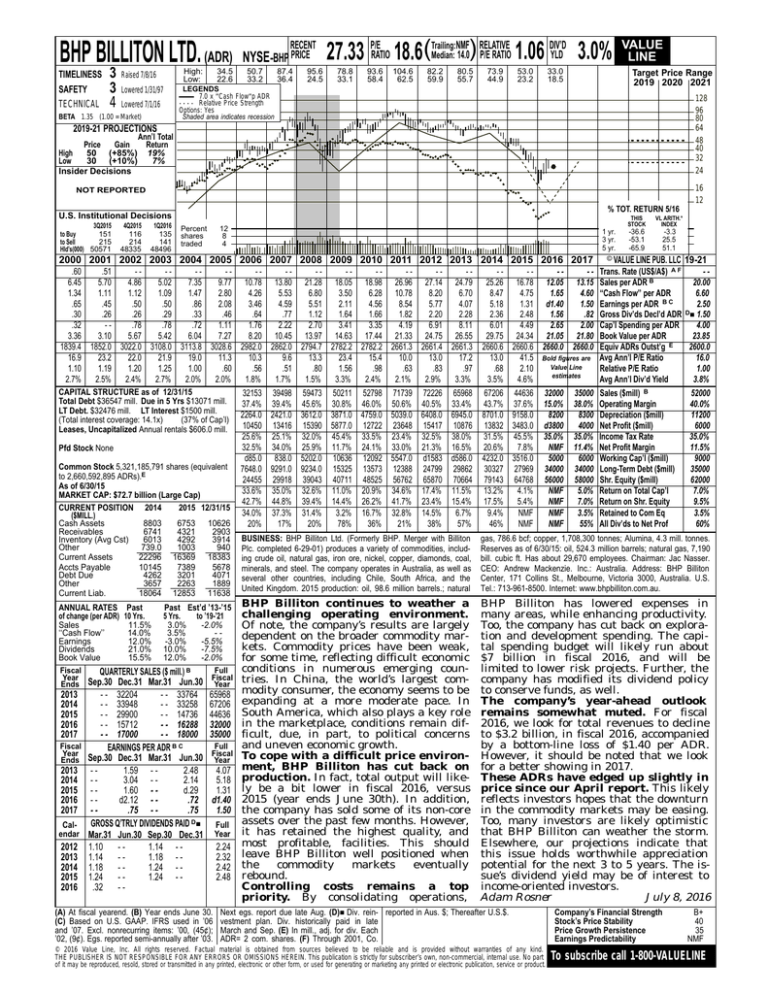
BHP Billiton continues to weather a
challenging operating environment.
Of note, the company’s results are largely
dependent on the broader commodity markets. Commodity prices have been weak,
for some time, reflecting difficult economic
conditions in numerous emerging countries. In China, the world’s largest commodity consumer, the economy seems to be
expanding at a more moderate pace. In
South America, which also plays a key role
in the marketplace, conditions remain difficult, due, in part, to political concerns
and uneven economic growth.
To cope with a difficult price environment, BHP Billiton has cut back on
production. In fact, total output will likely be a bit lower in fiscal 2016, versus
2015 (year ends June 30th). In addition,
the company has sold some of its non-core
assets over the past few months. However,
it has retained the highest quality, and
most profitable, facilities. This should
leave BHP Billiton well positioned when
the
commodity
markets
eventually
rebound.
Controlling costs remains a top
priority. By consolidating operations,
BHP Billiton has lowered expenses in
many areas, while enhancing productivity.
Too, the company has cut back on exploration and development spending. The capital spending budget will likely run about
$7 billion in fiscal 2016, and will be
limited to lower risk projects. Further, the
company has modified its dividend policy
to conserve funds, as well.
The company’s year-ahead outlook
remains somewhat muted. For fiscal
2016, we look for total revenues to decline
to $3.2 billion, in fiscal 2016, accompanied
by a bottom-line loss of $1.40 per ADR.
However, it should be noted that we look
for a better showing in 2017.
These ADRs have edged up slightly in
price since our April report. This likely
reflects investors hopes that the downturn
in the commodity markets may be easing.
Too, many investors are likely optimistic
that BHP Billiton can weather the storm.
Elsewhere, our projections indicate that
this issue holds worthwhile appreciation
potential for the next 3 to 5 years. The issue’s dividend yield may be of interest to
income-oriented investors.
Adam Rosner
July 8, 2016
Next egs. report due late Aug. (D)■ Div. rein- reported in Aus. $; Thereafter U.S.$.
vestment plan. Div. historically paid in late
March and Sep. (E) In mill., adj. for div. Each
ADR= 2 com. shares. (F) Through 2001, Co.
© 2016 Value Line, Inc. All rights reserved. Factual material is obtained from sources believed to be reliable and is provided without warranties of any kind.
THE PUBLISHER IS NOT RESPONSIBLE FOR ANY ERRORS OR OMISSIONS HEREIN. This publication is strictly for subscriber’s own, non-commercial, internal use. No part
of it may be reproduced, resold, stored or transmitted in any printed, electronic or other form, or used for generating or marketing any printed or electronic publication, service or product.
Company’s Financial Strength
Stock’s Price Stability
Price Growth Persistence
Earnings Predictability
B+
40
35
NMF
To subscribe call 1-800-VALUELINE


