After The Race

After The Race
The Boston Marathon is a local institution with over a century of history and tradition.
The race is run on Patriot’s Day, starting on the Hopkinton green and ending at the
Prudential Center in Boston’s Back Bay, 26.2 miles later. Key milestones along the route are Wellesley College, Heartbreak Hill, Kenmore Square and Commonwealth Avenue.
In a typical year as many as ten thousand runners will participate.
Planning for the race presents several logistical challenges for the race organizers. One major challenge is at the finish line. Runners as they cross the line may require a variety of services.
A few will need medical attention for problems ranging from blisters and leg cramps to severe dehydration and possibly heat exhaustion. The less severe problems, like blisters, can be handled by nurse practitioners, and do not demand immediate attention. The more severe can often not wait. A runner with cramps and dehydration will need a cot and oral liquids; a runner in worse shape may need intravenous fluids and possibly even a trip to a nearby emergency room.
Runners who are not in need of medical attention will need services so as to avoid the subsequent need for medical resources. At the finish runners need an area to continue to walk so that their muscles don’t cramp. After a while, they will want a place to sit and rest, where they can start the process of replenishing the nutrients and liquids that their bodies lost during the race. They may often need to use rest rooms, as well as phones.
Finally, they will need to retrieve their clothes from the storage vans that have traveled from Hopkinton to the Prudential center, and then to find a place to change.
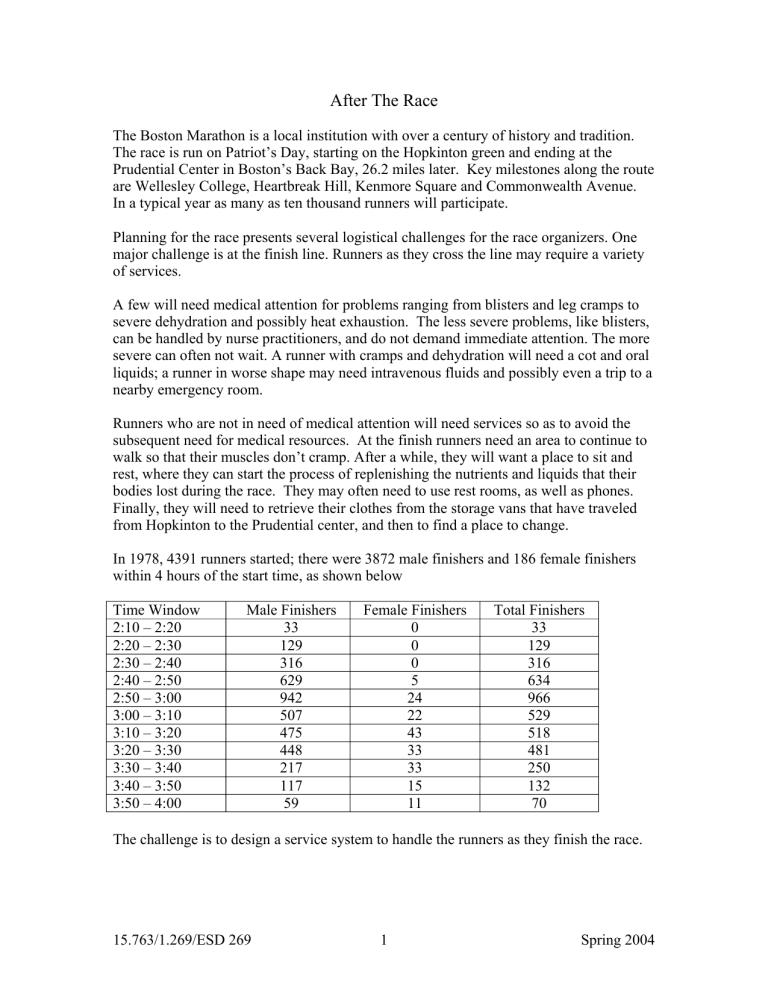
In 1978, 4391 runners started; there were 3872 male finishers and 186 female finishers within 4 hours of the start time, as shown below
Time Window
2:10 – 2:20
2:20 – 2:30
2:30 – 2:40
2:40 – 2:50
2:50 – 3:00
3:00 – 3:10
3:10 – 3:20
3:20 – 3:30
3:30 – 3:40
3:40 – 3:50
3:50 – 4:00
Male Finishers Female Finishers Total Finishers
33 0 33
129
316
0
0
129
316
629
942
507
475
448
217
117
59
5
24
22
43
33
33
15
11
634
966
529
518
481
250
132
70
The challenge is to design a service system to handle the runners as they finish the race.
15.763/1.269/ESD 269
Basic Queueing Theory
Notation
We categorize single-stage queuing systems by a three-component descriptor, A/B/m, where A denotes the distribution of inter-arrival times, B denotes the distribution of service times, and m is the number of servers. The notation M denotes an exponential distribution (Memory-less or Markovian) and G denotes a general distribution (for i. i. d. times, we denote this by GI).
When there is a maximum limit on the number of customers that can be in the system, we describe the queuing system by a four-component descriptor, A/B/m/k, for k being the limit.
Assumptions and Analysis for M/M/1 queue
• Single server
• Memory-less or Markovian arrival process: At any time t, the probability of an arrival in the next instant is independent of all past history (i. e., memory-less). That is, for
"small" ∆ t, the probability that the next arrival occurs in the time interval (t, t+ ∆ t) equals λ∆ t, where λ is the arrival rate.
The number of arrivals in a time interval of length τ is a Poisson random variable with mean λτ , and with variance λτ . The interarrival time between successive arrivals is an exponentially-distributed random variable with mean 1/ λ , and with variance (1/ λ )2.
• Memory-less or Markovian service process: Suppose the service process for a job starts at time 0 and has not completed by time t. Then, for "small" ∆ t, the probability that the service completes in the time interval (t, t+ ∆ t) equals µ∆ t, where µ is the service rate.
The service time is an exponentially-distributed random variable with mean 1/ µ , and with variance (1/ µ )2.
15.763/1.269/ESD 269 2 Spring
• An analysis of this queueing system is based on solving the "equations for motion" or probability transition equations for this system. Let Pr[n, t] denote the probability that there are n jobs or customers in the system at time t. Then the transition equations can be derived from the following general form (for small ∆ t):
Pr[n, t + ∆ t] = Pr[n, t ] * (1 λ∆ t µ∆ t) + µ∆ t * Pr[n+1, t ] + λ∆ t * Pr[n-1, t ]
• Let Π (n) = Pr[n, t =
•
] be the steady state probability for queue lengths. Then, key results are as follows:
Π (0) = 1 ρ
Π (n) = ρ n (1 ρ ) where ρ = λ/µ = the utilization level for the queue.
• Steady-state performance measures:
L = expected number in system = ρ/(1 − ρ)
Q = expected number in queue (not in service) = ρ2/(1 − ρ)
W = expected waiting time in system = 1/(µ − λ) = [ 1/(1 − ρ) ] ∗ [1/µ]
D = expected waiting time in queue = λ/µ(µ − λ) = [ ρ/(1 − ρ) ] ∗ [1/µ]
Note that L = λ W, and Q = λ D; i. e., Little's Law.
• M/M/1 model can be extended to multiple, parallel servers; to finite waiting rooms; to queue-dependent arrival or service rates.
• Model is useful for gross-level understanding
of congestion effects, and for examining design or planning tradeoffs
.
15.763/1.269/ESD 269 3 Spring
Approximation for General Arrival Process, General Service Times (GI/G/1)
• For a GI/G/1 queue, we assume we know the mean and coefficient of variation (std. deviation/mean) for the interarrival times, and the mean and coefficient of variation for the service times ( the “inter-completion” time):
1/λ mean time
1/µ mean time
SCVa
SCVs squared coefficient of variation for interarrival times squared coefficient of variation for service times
Note: SCV = 1 for exponential random variables (as occurs in M/M/1 model)
• We assume that utilization is less than one: ρ = λ/µ < 1; and we assume no limit on the queue size.
• A useful approximation is as follows:
D = expected waiting time in queue = [ ρ/(1 − ρ) ] ∗ [1/µ] * (SCVa + SCVs)/2
From this approximation we get the other common performance measures:
W = expected waiting time in system = D + 1/µ
L = expected number in system = λ W = λ * [D + 1/ µ ]
Q = expected number in queue (not in service)
= λ D = [ρ2/(1 − ρ)] * [(SCVa + SCVs)/2 ]
• To model networks of queues, this model is often used as a building block, where the departure stream from one queue is the arrival stream for another. Here we need approximate the SCV for the departure stream:
SCVd = (1 ρ 2) SCVa + ρ 2 SCVs
15.763/1.269/ESD 269 4 Spring
Assumptions and Analysis for M/G/
•
Queue
• Poisson arrivals with arrival rate λ ; any distribution for service times, where τ is the mean service time; and an unlimited number of servers.
• The steady-state number of customers in the system (and in service) is a Poisson random variable with mean equal to λτ , and with variance equal to λτ . That is the steady-state probabilities are as follows:
Pr [# in system = n] = ( λτ )n * e-
λτ
/n ! for n = 0, 1, 2, ....
• For λτ > 20 or 30, this distribution is well approximated by a normal distribution.
Assumptions and Analysis for M/G/k/k Queue
• Poisson arrivals with arrival rate λ; any distribution for service times, where τ is the mean service time; k servers; and a limit of at most k customers in the system at any point in time. That is, there is no waiting room, and a customer either enters service upon arrival or is lost due to the system being full (busy).
• The steady-state probabilities for the number of customers in the system (and in service) are as follows:
Pr [ # in system = n ] =
( ) n k
∑ i=0
( ) n ! i i!
for n = 0, 1, 2, .... k
• Pr [ # in system = k] is the "loss" probability: that is, the probability that a customer arrives and finds the system full.
• If the system is designed to have a very small loss probability, then the M/G/
•
model can be used to approximate the M/G/k/k system.
15.763/1.269/ESD 269 5 Spring
Assumptions and Analysis for M/M/k Queue
Poisson arrivals with arrival rate λ ; exponential service times with mean service rate µ
(mean service time = 1/ µ ); k servers. The system utilization is defined as ρ = λ /k µ
Expected time in queue,
E [ D ] =
⎛
⎜⎜ k
µ
1
− λ
⎞
⎟⎟
⎠
⎜⎜
(
1
( )
− ρ ) k k !
⎠
π
0
=
⎝
⎛
⎜⎜
1 -
ρ ⎛
ρ
⎞
⎟⎟
⎝
1 ⎞
µ
⎜⎜
(
1
( ) k
− ρ )
− 1 k !
⎟⎟ π
0 where,
π
0
=
1
(
1
( )
− ρ ) k k !
+ k
− 1
∑ i
= 0
( ) i i !
Approximation for M/G/k Queue
• A useful approximation is as follows:
D = expected waiting time in queue
= expected waiting time in queue for M/M/k queue * [(1 + SCVs)/2 ]
From this approximation we can get the other common performance measures.
15.763/1.269/ESD 269
Applications
• Facility planning for human service systems , e. g., hospitals
• Inventory management for one-for-one policies, e. g., spares provisioning.
• Capacity planning for telemarketing centers
• Fleet sizing for rail cars
• Crew planning for tending multiple machines (e.g., for repair, setup, loading)
15.763/1.269/ESD 269


