15.072 Computer project
advertisement
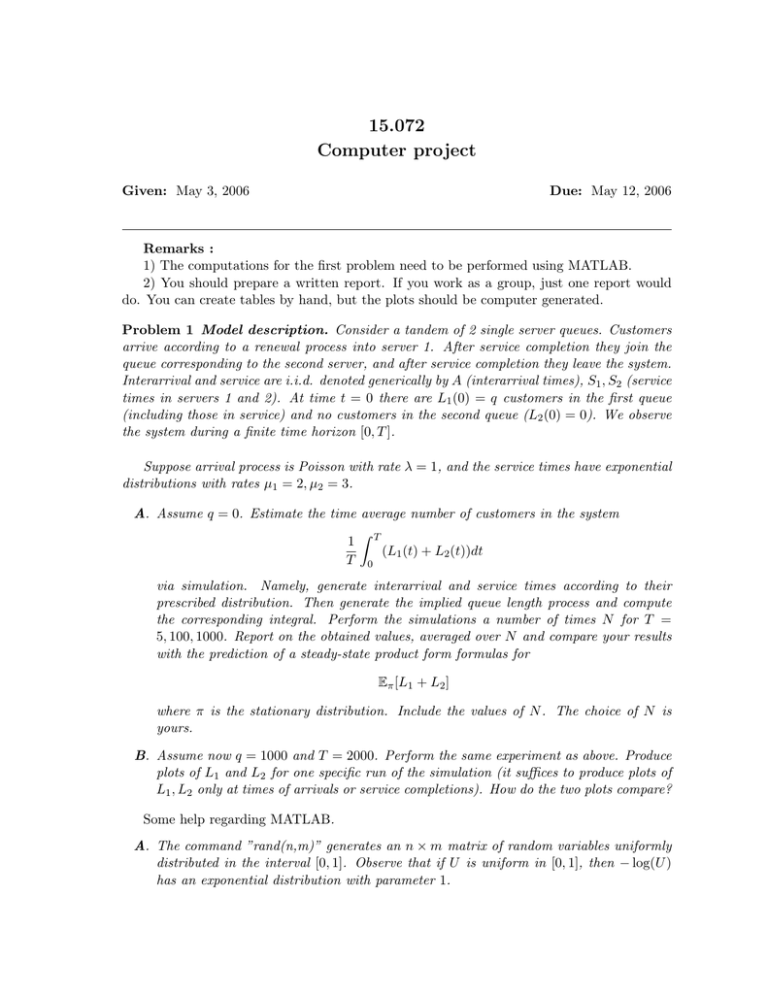
15.072 Computer project Given: May 3, 2006 Due: May 12, 2006 Remarks : 1) The computations for the first problem need to be performed using MATLAB. 2) You should prepare a written report. If you work as a group, just one report would do. You can create tables by hand, but the plots should be computer generated. Problem 1 Model description. Consider a tandem of 2 single server queues. Customers arrive according to a renewal process into server 1. After service completion they join the queue corresponding to the second server, and after service completion they leave the system. Interarrival and service are i.i.d. denoted generically by A (interarrival times), S1 , S2 (service times in servers 1 and 2). At time t = 0 there are L1 (0) = q customers in the first queue (including those in service) and no customers in the second queue (L2 (0) = 0). We observe the system during a finite time horizon [0, T ]. Suppose arrival process is Poisson with rate λ = 1, and the service times have exponential distributions with rates µ1 = 2, µ2 = 3. A. Assume q = 0. Estimate the time average number of customers in the system � 1 T (L1 (t) + L2 (t))dt T 0 via simulation. Namely, generate interarrival and service times according to their prescribed distribution. Then generate the implied queue length process and compute the corresponding integral. Perform the simulations a number of times N for T = 5, 100, 1000. Report on the obtained values, averaged over N and compare your results with the prediction of a steady­state product form formulas for Eπ [L1 + L2 ] where π is the stationary distribution. Include the values of N . The choice of N is yours. B. Assume now q = 1000 and T = 2000. Perform the same experiment as above. Produce plots of L1 and L2 for one specific run of the simulation (it suffices to produce plots of L1 , L2 only at times of arrivals or service completions). How do the two plots compare? Some help regarding MATLAB. A. The command ”rand(n,m)” generates an n × m matrix of random variables uniformly distributed in the interval [0, 1]. Observe that if U is uniform in [0, 1], then − log(U ) has an exponential distribution with parameter 1. 2 Computer project May 3, 2006 B. A command ”plot(x,y)” generates a plot of x vs. y provided that they have the same size. Problem 2 (This problem is much easier done in a group.) Go to a nearest Starbucks or Au Bon Pain (or any coffee shop) and spend at least an hour there. Record the arrival times of the customers as well as the total number of customers in the coffee shop (which is easily done by first counting the initial number of customers and then counting the arrivals and departures times). Compute average arrival rate and average number in the system. Infer average system time using the Little’s Law. Tag several randomly chosen customers and record their system time. Compare the average system time for the observed customers with the prediction of the Little’s Law. You can partition the duties: one records the arrival, one records departures, one buys coffee ... Report on your results.
