Homework 4
advertisement
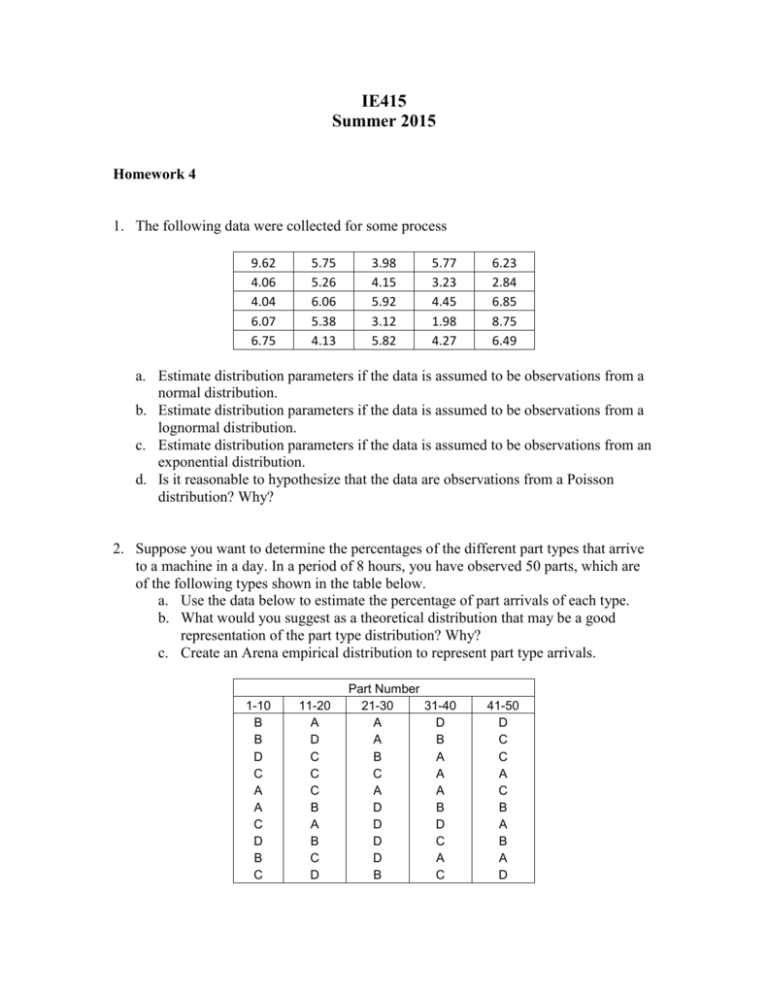
IE415 Summer 2015 Homework 4 1. The following data were collected for some process 9.62 4.06 4.04 6.07 6.75 5.75 5.26 6.06 5.38 4.13 3.98 4.15 5.92 3.12 5.82 5.77 3.23 4.45 1.98 4.27 6.23 2.84 6.85 8.75 6.49 a. Estimate distribution parameters if the data is assumed to be observations from a normal distribution. b. Estimate distribution parameters if the data is assumed to be observations from a lognormal distribution. c. Estimate distribution parameters if the data is assumed to be observations from an exponential distribution. d. Is it reasonable to hypothesize that the data are observations from a Poisson distribution? Why? 2. Suppose you want to determine the percentages of the different part types that arrive to a machine in a day. In a period of 8 hours, you have observed 50 parts, which are of the following types shown in the table below. a. Use the data below to estimate the percentage of part arrivals of each type. b. What would you suggest as a theoretical distribution that may be a good representation of the part type distribution? Why? c. Create an Arena empirical distribution to represent part type arrivals. 1-10 B B D C A A C D B C 11-20 A D C C C B A B C D Part Number 21-30 31-40 A D A B B A C A A A D B D D D C D A B C 41-50 D C C A C B A B A D 3. Suppose 40 observations of a random system component have been recorded as shown in the table below (these numbers are sorted). 0.0345 0.2684 0.5314 0.7624 0.1079 0.2891 0.5542 0.7788 0.1313 0.3011 0.5563 0.8212 0.1452 0.3254 0.5841 0.8452 0.1788 0.3518 0.5942 0.8645 0.2101 0.3614 0.6157 0.8691 0.2249 0.4418 0.6895 0.9011 0.2351 0.4559 0.7160 0.9124 0.2389 0.4803 0.7212 0.9348 0.2487 0.4989 0.7428 0.9842 a. Compute estimates of the coefficient of variation, and skewness. Do these estimates provide any information about possible distributions that may fit this data? b. Using k = 8, perform a 2 goodness-of-fit test that this random system component is adequately represented with a U[0,1] distribution. Suppose 100,000 random numbers from the same random component have been recorded, and performing the same test with k = 250 (even though this is outside the guidelines for k) obtains the test statistic = 207.19. Does this change the conclusion (obtained from 40 observations)? 4. In problem 3 (with 40 observations), rather than using a 2 goodness-of-fit test, a Kolmogorov-Smirnov (KS) test can be used. The specific case of the KS test used will be the all parameters known case. 5. Use Crystal Ball to fit normal and lognormal distributions to the data from problem 1. a. What distribution does Crystal Ball select as the best fit? b. Report the p-values from the Chi-square, K-S, and A-D tests. 6. The data below are queue times for 30 customers. They are in the order that the customers left the queue. Customer 1 2 3 4 5 6 7 Queue Time (min) 0.0 1.4 6.8 9.8 9.2 8.1 7.9 8 9 10 11 12 13 14 15 16 17 18 19 20 21 22 23 24 25 26 27 28 29 30 5.5 6.8 8.8 18.1 31.7 23.4 25.6 29.1 50.2 40.0 39.4 31.3 33.2 32.9 30.5 30.9 34.5 32.6 33.8 34.2 31.9 29.0 30.6 a. Compute Lag 1, 2, and 3 correlation estimates. b. Plot xi vs xi+1 and xi vs xi+2 scatter plots.
