probability n2
advertisement
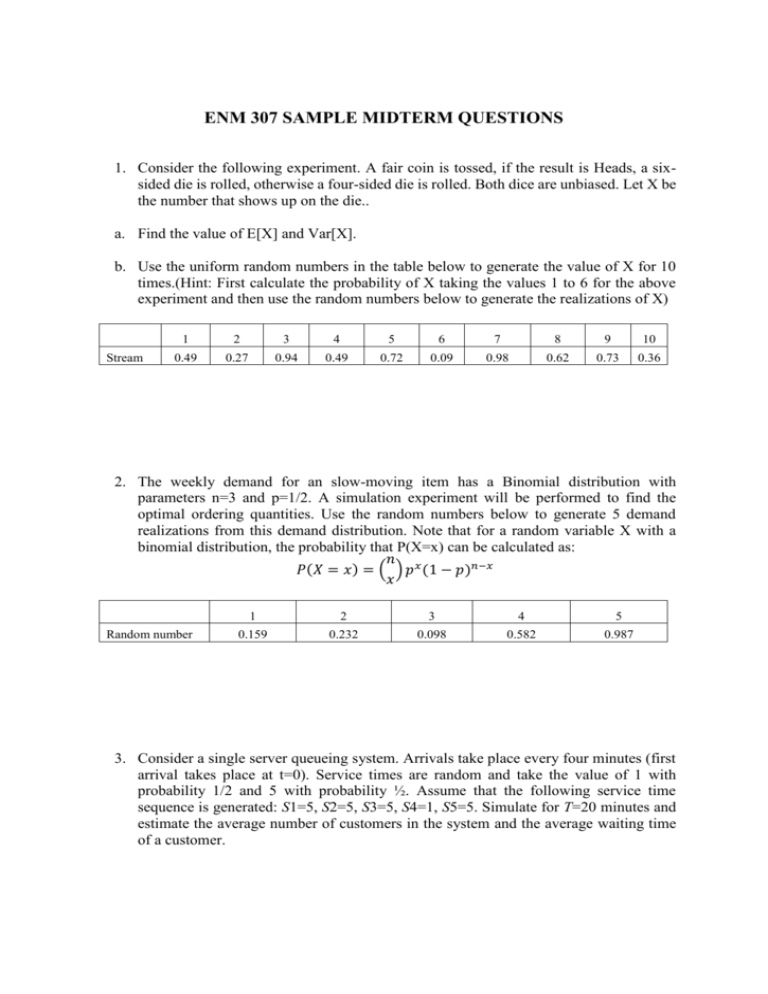
ENM 307 SAMPLE MIDTERM QUESTIONS 1. Consider the following experiment. A fair coin is tossed, if the result is Heads, a sixsided die is rolled, otherwise a four-sided die is rolled. Both dice are unbiased. Let X be the number that shows up on the die.. a. Find the value of E[X] and Var[X]. b. Use the uniform random numbers in the table below to generate the value of X for 10 times.(Hint: First calculate the probability of X taking the values 1 to 6 for the above experiment and then use the random numbers below to generate the realizations of X) Stream 1 2 3 4 5 6 7 8 9 10 0.49 0.27 0.94 0.49 0.72 0.09 0.98 0.62 0.73 0.36 2. The weekly demand for an slow-moving item has a Binomial distribution with parameters n=3 and p=1/2. A simulation experiment will be performed to find the optimal ordering quantities. Use the random numbers below to generate 5 demand realizations from this demand distribution. Note that for a random variable X with a binomial distribution, the probability that P(X=x) can be calculated as: 𝑛 𝑃(𝑋 = 𝑥) = ( ) 𝑝 𝑥 (1 − 𝑝)𝑛−𝑥 𝑥 Random number 1 2 3 4 5 0.159 0.232 0.098 0.582 0.987 3. Consider a single server queueing system. Arrivals take place every four minutes (first arrival takes place at t=0). Service times are random and take the value of 1 with probability 1/2 and 5 with probability ½. Assume that the following service time sequence is generated: S1=5, S2=5, S3=5, S4=1, S5=5. Simulate for T=20 minutes and estimate the average number of customers in the system and the average waiting time of a customer. 4. Consider a two-teller bank where each teller has its separate queue. Customers are allowed to jockey between queues at departure instances. Note that a customer only switches queues at departure instances and if the other queue is shorter. New arrivals join the shorter queue and choose queue 1 if both queues are of equal length. Let n1(t) and n2(t) denote the number of customers in the system in queues 1 and 2 at time t. The following customer inter-arrival times (Ai) and service times for tellers 1 (S1i) and tellers 2 (S2i) have been generated: A1 = 1.8, A2 = 3.2, A3 = 1.1, A4 = 5.2, S11 = 2.1, S12 = 1.6, S13 = 5.2, S14 = 0.8 and S21 = 4.9, S22 = 2.7, S23 = 4.3, S24 = 2.3. a. Assume that n1(0) = 2, n2(0) = 3 and that both servers have just started processing at time 0. Use the above inter-arrival times and server times to simulate the system for 10 minutes using the below table: b. Find the time average number of total customers over 10 minutes.

