National Archives of Scotland (HH1/568) (HH1/568) Table E Table E, Part 1
advertisement
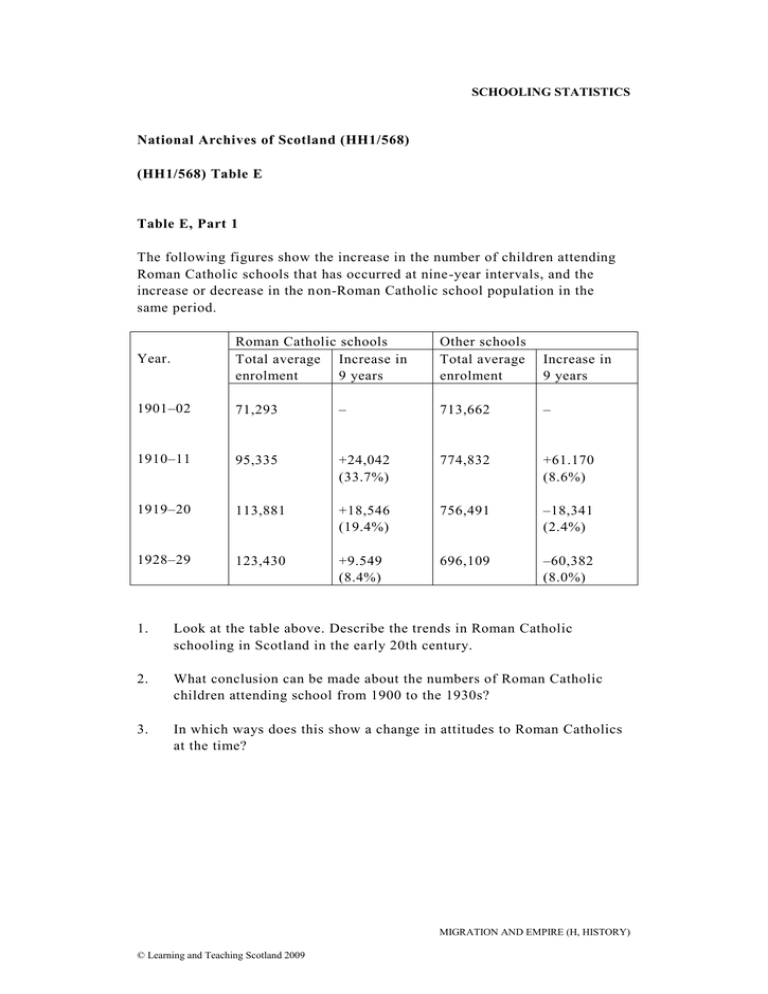
SCHOOLING STATISTICS National Archives of Scotland (HH1/568) (HH1/568) Table E Table E, Part 1 The following figures show the increase in the number of children attending Roman Catholic schools that has occurred at nine-year intervals, and the increase or decrease in the non-Roman Catholic school population in the same period. Year. Roman Catholic schools Total average Increase in enrolment 9 years Other schools Total average enrolment Increase in 9 years 1901–02 71,293 – 713,662 – 1910–11 95,335 +24,042 (33.7%) 774,832 +61.170 (8.6%) 1919–20 113,881 +18,546 (19.4%) 756,491 –18,341 (2.4%) 1928–29 123,430 +9.549 (8.4%) 696,109 –60,382 (8.0%) 1. Look at the table above. Describe the trends in Roman Catholic schooling in Scotland in the early 20th century. 2. What conclusion can be made about the numbers of Roman Catholic children attending school from 1900 to the 1930s? 3. In which ways does this show a change in attitudes to Roman Catholics at the time? MIGRATION AND EMPIRE (H, HISTORY) © Learning and Teaching Scotland 2009
