D [ research
advertisement
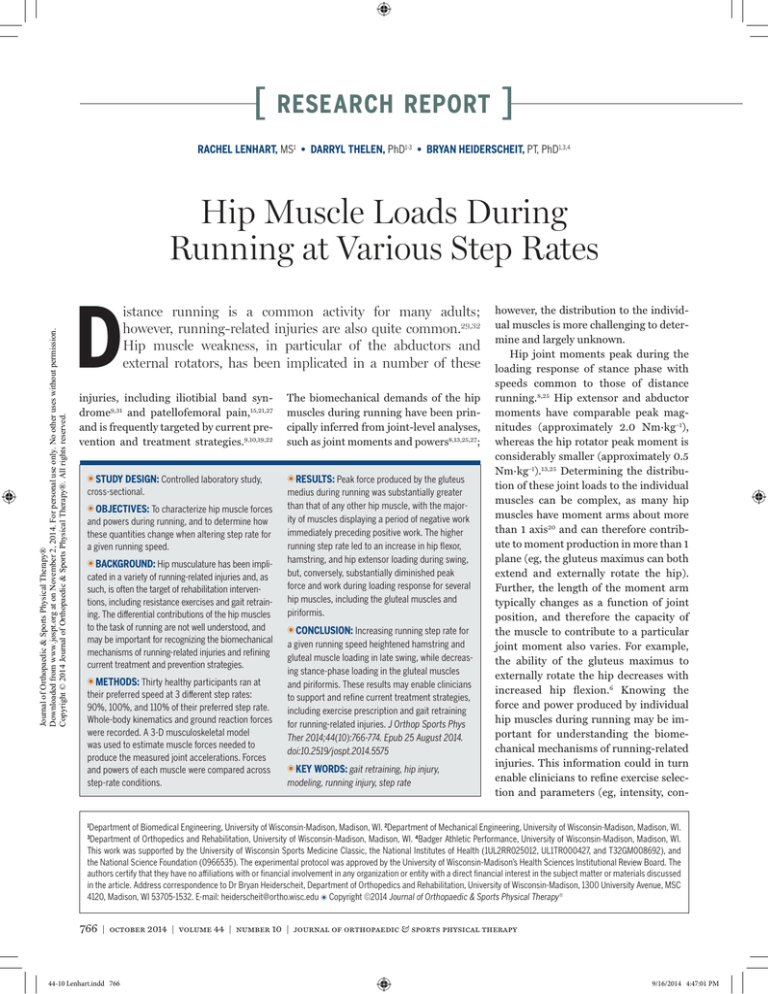
[ research report ] RACHEL LENHART, MS1 • DARRYL THELEN, PhD1-3 • BRYAN HEIDERSCHEIT, PT, PhD1,3,4 Journal of Orthopaedic & Sports Physical Therapy® Downloaded from www.jospt.org at on November 2, 2014. For personal use only. No other uses without permission. Copyright © 2014 Journal of Orthopaedic & Sports Physical Therapy®. All rights reserved. Hip Muscle Loads During Running at Various Step Rates D istance running is a common activity for many adults; however, running-related injuries are also quite common.29,32 Hip muscle weakness, in particular of the abductors and external rotators, has been implicated in a number of these injuries, including iliotibial band syndrome9,31 and patellofemoral pain,15,21,27 and is frequently targeted by current prevention and treatment strategies.9,10,19,22 TTSTUDY DESIGN: Controlled laboratory study, cross-sectional. TTOBJECTIVES: To characterize hip muscle forces and powers during running, and to determine how these quantities change when altering step rate for a given running speed. TTBACKGROUND: Hip musculature has been impli- cated in a variety of running-related injuries and, as such, is often the target of rehabilitation interventions, including resistance exercises and gait retraining. The differential contributions of the hip muscles to the task of running are not well understood, and may be important for recognizing the biomechanical mechanisms of running-related injuries and refining current treatment and prevention strategies. TTMETHODS: Thirty healthy participants ran at their preferred speed at 3 different step rates: 90%, 100%, and 110% of their preferred step rate. Whole-body kinematics and ground reaction forces were recorded. A 3-D musculoskeletal model was used to estimate muscle forces needed to produce the measured joint accelerations. Forces and powers of each muscle were compared across step-rate conditions. The biomechanical demands of the hip muscles during running have been principally inferred from joint-level analyses, such as joint moments and powers8,13,25,27; TTRESULTS: Peak force produced by the gluteus medius during running was substantially greater than that of any other hip muscle, with the majority of muscles displaying a period of negative work immediately preceding positive work. The higher running step rate led to an increase in hip flexor, hamstring, and hip extensor loading during swing, but, conversely, substantially diminished peak force and work during loading response for several hip muscles, including the gluteal muscles and piriformis. TTCONCLUSION: Increasing running step rate for a given running speed heightened hamstring and gluteal muscle loading in late swing, while decreasing stance-phase loading in the gluteal muscles and piriformis. These results may enable clinicians to support and refine current treatment strategies, including exercise prescription and gait retraining for running-related injuries. J Orthop Sports Phys Ther 2014;44(10):766-774. Epub 25 August 2014. doi:10.2519/jospt.2014.5575 TTKEY WORDS: gait retraining, hip injury, modeling, running injury, step rate however, the distribution to the individual muscles is more challenging to determine and largely unknown. Hip joint moments peak during the loading response of stance phase with speeds common to those of distance running.8,25 Hip extensor and abductor moments have comparable peak magnitudes (approximately 2.0 Nm·kg–1), whereas the hip rotator peak moment is considerably smaller (approximately 0.5 Nm·kg–1).13,25 Determining the distribution of these joint loads to the individual muscles can be complex, as many hip muscles have moment arms about more than 1 axis20 and can therefore contribute to moment production in more than 1 plane (eg, the gluteus maximus can both extend and externally rotate the hip). Further, the length of the moment arm typically changes as a function of joint position, and therefore the capacity of the muscle to contribute to a particular joint moment also varies. For example, the ability of the gluteus maximus to externally rotate the hip decreases with increased hip flexion.6 Knowing the force and power produced by individual hip muscles during running may be important for understanding the biomechanical mechanisms of running-related injuries. This information could in turn enable clinicians to refine exercise selection and parameters (eg, intensity, con- Department of Biomedical Engineering, University of Wisconsin-Madison, Madison, WI. 2Department of Mechanical Engineering, University of Wisconsin-Madison, Madison, WI. Department of Orthopedics and Rehabilitation, University of Wisconsin-Madison, Madison, WI. 4Badger Athletic Performance, University of Wisconsin-Madison, Madison, WI. This work was supported by the University of Wisconsin Sports Medicine Classic, the National Institutes of Health (1UL2RR025012, UL1TR000427, and T32GM008692), and the National Science Foundation (0966535). The experimental protocol was approved by the University of Wisconsin-Madison’s Health Sciences Institutional Review Board. The authors certify that they have no affiliations with or financial involvement in any organization or entity with a direct financial interest in the subject matter or materials discussed in the article. Address correspondence to Dr Bryan Heiderscheit, Department of Orthopedics and Rehabilitation, University of Wisconsin-Madison, 1300 University Avenue, MSC 4120, Madison, WI 53705-1532. E-mail: heiderscheit@ortho.wisc.edu t Copyright ©2014 Journal of Orthopaedic & Sports Physical Therapy® 1 3 766 | october 2014 | volume 44 | number 10 | journal of orthopaedic & sports physical therapy 44-10 Lenhart.indd 766 9/16/2014 4:47:01 PM Journal of Orthopaedic & Sports Physical Therapy® Downloaded from www.jospt.org at on November 2, 2014. For personal use only. No other uses without permission. Copyright © 2014 Journal of Orthopaedic & Sports Physical Therapy®. All rights reserved. traction type) to better reflect the specific demands of the activity. Increasing running step rate for a given running speed, which conversely reduces step length, has been advocated as a rehabilitation strategy to reduce hip joint loads for those with running-related injuries, thereby promoting recovery and reducing reinjury risk.13 A simple 10% increase in running step rate while maintaining preferred running speed has been shown to reduce energy absorption at the hip during the loading response, with an accompanying reduction in hip abductor and internal rotator moments.13 However, these potentially beneficial alterations to hip mechanics during loading response are accompanied by increased activation of the hamstring and gluteal muscles during late swing.4 Further analyses are needed to understand the individual muscle loads corresponding to these joint-level biomechanical findings. Our primary goal was to characterize hip muscle kinetics during running in a healthy adult population, providing an estimate of the individual muscle contributions throughout the stride cycle. In addition, we sought to determine how hip muscle kinetics changed with running step rate. Based on previous electromyography (EMG) and joint-level findings,4,13 we hypothesized that a higher step rate would increase hamstring and gluteus maximus muscle loading during late swing but decrease loading of the gluteal muscles in early stance. METHODS Participants T hirty healthy, recreational runners (15 men; mean SD age, 33 14 years; mass, 68.6 10.9 kg; height, 1.75 0.11 m) were recruited for this study. All participants had a running volume that exceeded 24.1 km·wk–1 during the preceding 3 months. Participants had no pain while running, no history of surgery to the lower limbs, and no injury of the lower limbs in the previous 3 months. The protocol for the study was approved by the University of WisconsinMadison's Health Sciences Institutional Review Board, and all volunteers provided appropriate written informed consent. Data Acquisition The preferred step rate for each participant was determined during a 5-minute treadmill run at his or her preferred speed. The number of right-foot strikes was counted during a 30-second period and multiplied by 4, then recomputed over a subsequent 30-second interval to ensure consistency. Each participant was then asked to run at a prescribed step rate equal to 90%, 100%, or 110% of their preferred step rate. Step rate was controlled by having participants synchronize foot-ground contact with the beat of an audible metronome. The participant’s preferred speed was kept constant across the step-rate conditions, and the condition order was randomized. Data collection did not begin until the participant was able to maintain the target step rate for a minimum of 1 minute, as determined by visual inspection. Wholebody-kinematics were recorded (200 Hz) for 15 seconds during each of the running conditions using an 8-camera, passive motion-capture system (Motion Analysis Corporation, Santa Rosa, CA). Ground reaction forces and moments were simultaneously recorded (2000 Hz) using an instrumented treadmill (Bertec Corporation, Columbus, OH). A total of 40 markers were used to track the motion of the bilateral upper and lower extremities, including 21 markers placed on anatomical landmarks and 14 placed on rigid plates strapped to the thighs and shanks.13 A standing calibration trial was also collected to establish joint centers, bodysegment coordinate systems, segment lengths, and local positions of tracking markers. Marker position data were lowpass filtered at 12 Hz, and ground reaction forces were low-pass filtered at 50 Hz, using fifth-order, cross-validation splines.33 Five right-footed strides from each condition were extracted for this analysis. Data Analysis Complete details of the musculoskeletal model and computational procedures have been previously described.17 In brief, a 3-D, whole-body model with 29 degrees of freedom (DOF) was scaled to each participant. The pelvis was the base segment, with 6 DOF. The hip was a 3 DOF joint modeled as a ball in socket. The tibiofemoral joint had 1 DOF, with nonsagittal rotations and translations being a function of knee flexion.1 One DOF also existed at the patellofemoral joint, with patellar position and orientation determined as a function of knee flexion angle. The ankle had 1 DOF, allowing sagittal rotation. The hip joint center in the pelvis reference frame was calibrated using a hip circumduction task and a functional joint center identification routine.24 Pelvis position, orientation, and joint angles were computed at each frame of running using an inverse kinematics routine that minimized the weighted sum of squared errors between the measured and model marker positions.18 Generalized coordinates of the model were fit using fifthorder, cross-validation splines,33 which were then numerically differentiated to obtain generalized speeds and generalized accelerations. Lower extremity muscle forces were estimated using a musculoskeletal model that included geometric descriptions of 96 musculotendon units acting about the low back, hip, knee, and ankle joints.1 Individual muscle forces (Fi) were assumed proportional to their activation level from zero to the individual muscle’s maximum isometric force (ai): Fi = ai × Fi0, where Fi0 is the assumed maximum isometric force.1 A muscle-force distribution algorithm, which minimized the muscle-volume weighted sum of muscle activations squared (ΣViai2), was used to determine muscle forces required to generate the measured accelerations of each frame of the running cycle.12 The weighting factor for each muscle was taken as that muscle’s volume, which was the product of the muscle’s optimal fiber length and physiological cross-sectional journal of orthopaedic & sports physical therapy | volume 44 | number 10 | october 2014 | 767 44-10 Lenhart.indd 767 9/16/2014 4:47:02 PM Journal of Orthopaedic & Sports Physical Therapy® Downloaded from www.jospt.org at on November 2, 2014. For personal use only. No other uses without permission. Copyright © 2014 Journal of Orthopaedic & Sports Physical Therapy®. All rights reserved. [ area. We previously showed that estimates of muscle force patterns using this model-based approach agree well with bursts and phasing of major lower extremity muscle EMG patterns over a running stride.17 Muscle power was obtained by calculating the product of muscle force and velocity, with positive and negative work determined via numerical integration. Muscle forces and powers were normalized by the participant’s body mass for comparison, and only those musculotendon units that cross the hip joint are described.20 research report TABLE 1 Muscle/Period ] Peak Muscle Forces During Running at 90%, 100%, and 110% of Preferred Step Rate* 90% 100% 110% Biceps femoris long head Stance 3.65 1.03 3.83 0.98 4.07 0.97‡ Late swing 4.69 0.91 5.19 0.94 5.25 0.90‡ 7.95 2.22 8.38 2.04 8.95 2.08‡ † 12.12 2.33 13.54 2.35 13.98 2.23‡ 18.01 3.22† 15.80 2.89 14.57 2.86†‡ 5.41 1.49 5.92 1.60 6.04 1.62‡ 34.60 5.23† 32.05 4.03 28.65 3.63†‡ 5.84 1.68 6.71 2.17 7.40 2.25†‡ 20.82 3.30†‡ † Semimembranosus Stance Late swing Gluteus maximus Stance Late swing † Gluteus medius Statistical Analysis Stance Peak muscle forces within specific periods were compared across conditions using repeated-measures analysis of variance (ANOVA), with step rate as a repeated factor. For muscles with multiple peaks in force, the periods of interest were stance, early swing, and late swing. Positive and negative work performed by the hip muscles across the entire stride cycle were compared across conditions using repeated-measures ANOVA. All post hoc analyses were completed using Tukey’s honestly significant difference. Statistical analyses were completed using STATISTICA Version 6.1 (StatSoft, Inc, Tulsa, OK), with a significance level of P<.05. Late swing Gluteus minimus 24.25 4.22† 22.97 3.65 Early swing 8.54 2.84† 9.76 2.99 9.52 2.85‡ Late swing 3.36 1.10† 3.86 1.34 4.25 1.43†‡ 1.82 0.42† 1.97 0.38 2.12 0.45†‡ Stance Tensor fascia latae Early swing Rectus femoris Stance 9.98 2.94† 8.93 2.78 7.88 2.84†‡ Early swing 7.28 1.59† 8.00 1.43 9.11 1.79†‡ 0.38 0.09† 0.41 0.08 0.46 0.10†‡ Sartorius Early swing Psoas Early swing 12.78 3.63 13.19 2.94 13.36 3.17 17.63 3.96† 19.29 3.53 20.43 4.16†‡ 3.01 0.97† 2.69 0.89 2.61 0.97‡ 3.36 0.86† 3.62 0.75 3.76 0.76‡ 1.57 0.41 1.59 0.36 1.63 0.37 2.97 0.98 2.56 0.82†‡ Iliacus Early swing Adductor magnus Stance RESULTS Adductor brevis P Adductor longus articipants’ preferred running speeds ranged from 2.4 to 3.8 m·s–1 (mean SD, 2.81 0.38 m·s–1), and preferred step rates ranged from 156 to 192 steps per minute (mean SD, 174 9 steps per minute). During running at preferred step rate, the largest average peak hip muscle force production occurred in the gluteus medius during the loading response of stance (32 N·kg–1) (TABLE 1). The gluteus minimus and maximus, rectus femoris, and semimembranosus reached average peak forces between 8 and 23 N·kg–1 during this same period. The largest average peak hip muscle force during early swing was produced by the † Early swing Early swing Piriformis Stance 3.47 1.13 Early swing 1.27 0.42 1.53 0.39 1.78 0.37†‡ Late swing 1.20 0.61 1.29 0.57 1.34 0.49 † *Values are mean SD N·kg–1. For muscles with multiple peaks, the range queried for each peak is listed based on the period of the running cycle. † Different from 100% condition (P<.05). ‡ Different from 90% condition (P<.05). iliacus (19 N·kg–1) and the semimembranosus (14 N·kg–1) during late swing. Step rate had minimal effect on the temporal pattern of muscle forces (FIGURE 1) but did alter peak forces produced (TABLE 1; APPENDIX TABLE 1, available online). During loading response, peak forces of the gluteal muscles, rectus femoris, adductor magnus, and piriformis significantly decreased as step rate increased. In contrast, the biceps femoris long head and semimembranosus peak forces in- 768 | october 2014 | volume 44 | number 10 | journal of orthopaedic & sports physical therapy 44-10 Lenhart.indd 768 9/16/2014 4:47:02 PM BFL ‡ 10 0 0 40 15 * ‡ * AddMag 10 20 5 0 15 3 10 5 0 2 * 2 AddLong RF 0 1 0 0 4 * 10 Piriformis Sartorius 20 0 0 20 40 60 80 100 Cycle, % 1 0 0.5 * ‡ AddBrev * 5 0 TFL GMin Psoas * 1 5 * ‡ 10 2 0 10 20 0 ‡ 3 † * Iliacus ‡ † 5 0 –1 Normalized Muscle Force, N·kg Journal of Orthopaedic & Sports Physical Therapy® Downloaded from www.jospt.org at on November 2, 2014. For personal use only. No other uses without permission. Copyright © 2014 Journal of Orthopaedic & Sports Physical Therapy®. All rights reserved. * SM GMed GMax 20 0 20 40 60 80 * 2 0 100 * 0 20 Cycle, % 90% of preferred step rate 100% of preferred step rate 40 60 80 100 Cycle, % 110% of preferred step rate FIGURE 1. Mean muscle force (N·kg–1) production across the running cycle. The shaded area indicates 1 SD of force produced across all participants at the preferred (100%) step-rate condition. The other step rates (90% and 110% of preferred step rate) had similar variance (not shown). The vertical dashed line indicates toe-off. *All conditions were different from one another (P<.05). †90% different from 110% (P<.05). ‡90% different from 100% and 110% (P<.05). Abbreviations: AddBrev, adductor brevis; AddLong, adductor longus; AddMag, adductor magnus; BFL, biceps femoris long head; GMax, gluteus maximus; GMed, gluteus medius; GMin, gluteus minimus; RF, rectus femoris; SM, semimembranosus; TFL, tensor fascia latae. creased with step rate during this period. During early swing, several muscles showed an increase in force when the step rate was increased, including the tensor fascia latae, gluteus minimus, rectus femoris, and adductor brevis. During late swing, the hamstrings and gluteal muscles produced higher forces as step rate increased. Unique force and velocity profiles between the muscles led to distinctive mean power production (FIGURE 2) and work values (TABLE 2; APPENDIX TABLE 2, available online) across the running cycle. While the hamstrings performed only positive work during loading response, the glu- teals and piriformis performed negative work for a period prior to positive work. These muscles tended to produce less net work (positive plus negative) across the running cycle as step rate increased. The psoas, iliacus, and adductor brevis performed negative work in late stance and positive work in early swing. During early swing, the positive work from the iliacus increased with step rate, whereas the negative work performed by the tensor fascia latae decreased as step rate increased. The rectus femoris performed largely negative work in loading response and early swing, with reduced work as step rate increased from the 90% condi- tion. In late swing, the hamstring muscles performed negative work, followed by positive work just before foot-ground contact. Both the biceps femoris long head and the semimembranosus performed approximately 10% more negative work with the increase in step rate over the preferred step rate. DISCUSSION T he purpose of this study was to characterize hip muscle forces and powers produced during running, and to determine the effect of changing step rate. As hypothesized, increasing journal of orthopaedic & sports physical therapy | volume 44 | number 10 | october 2014 | 769 44-10 Lenhart.indd 769 9/16/2014 4:47:03 PM [ TABLE 2 Muscle/Work research report Positive and Negative Work Performed by Each Muscle Across the Running Cycle at 3 Different Step-Rate Conditions (90%, 100%, and 110% of Preferred)* 90% 100% 110% Biceps femoris long head Positive 0.044 0.017 0.045 0.015 0.045 0.015 Negative –0.055 0.014 –0.056 0.015 –0.060 0.017†‡ Journal of Orthopaedic & Sports Physical Therapy® Downloaded from www.jospt.org at on November 2, 2014. For personal use only. No other uses without permission. Copyright © 2014 Journal of Orthopaedic & Sports Physical Therapy®. All rights reserved. Semimembranosus Positive 0.110 0.038 0.100 0.034 0.100 0.034 Negative –0.170 0.041† –0.180 0.042 –0.200 0.048†‡ 0.210 0.066† 0.170 0.058 0.150 0.048‡ † –0.051 0.030 –0.033 0.036 –0.022 0.021†‡ 0.260 0.063† Gluteus maximus Positive Negative Gluteus medius 0.210 0.048 0.170 0.042†‡ † –0.100 0.033 –0.073 0.030†‡ Positive 0.150 0.049† 0.130 0.044 0.100 0.038†‡ Negative –0.099 0.033 –0.099 0.029 –0.080 0.025†‡ Positive Negative –0.110 0.038 Gluteus minimus Tensor fascia latae Positive 0.013 0.005 0.013 0.005 0.012 0.005 Negative –0.032 0.010 –0.032 0.010 –0.030 0.001†‡ Rectus femoris Positive 0.080 0.029† 0.074 0.025 0.067 0.023†‡ Negative –0.370 0.093† –0.350 0.088 –0.340 0.082‡ Sartorius Positive 0.015 0.004 0.015 0.003 0.016 0.003 Negative –0.005 0.002 –0.004 0.002 –0.003 0.001†‡ Psoas Positive 0.099 0.031 0.100 0.024 0.100 0.022 Negative –0.043 0.019 –0.039 0.015 –0.035 0.016‡ Iliacus Positive 0.150 0.033† 0.170 0.035 0.190 0.037†‡ Negative –0.089 0.030† –0.079 0.030 –0.075 0.030‡ Adductor magnus Positive 0.033 0.014† 0.030 0.014 0.027 0.014‡ Negative –0.007 0.005 –0.006 0.004 –0.004 0.003†‡ Adductor brevis Positive Negative 0.035 0.014 0.038 0.014 0.037 0.013 –0.021 0.011 –0.019 0.009 –0.015 0.007†‡ Adductor longus Positive 0.026 0.009 0.028 0.010 0.027 0.009 Negative –0.015 0.006† –0.013 0.005 –0.011 0.004†‡ Positive 0.017 0.010† 0.013 0.008 0.011 0.006†‡ Negative –0.013 0.006 –0.011 0.005 –0.010 0.004‡ Piriformis *Values are mean SD J·kg–1. † Different from 100% condition (P<.05). ‡ Different from 90% condition (P<.05). † ] running step rate heightened hamstring and gluteus maximus muscle loading in late swing, an effect likely reflecting the greater limb decelerations needed to position the limb for foot-ground contact. However, after foot strike, an increased step rate results in a more erect limb posture,13,17 which lessens the hip muscle forces and powers needed in the loadingresponse phase of stance. The decreased loading was particularly evident in the gluteal muscles and piriformis, which are muscles often implicated in running injuries.2,9,16,23,29 We previously found that model-estimated muscle forces were in temporal agreement with activation patterns from experimentally obtained EMG,17 giving us confidence in our muscle force and power estimates. Further, the peak forces and temporal patterns of the hamstrings, gluteus maximus and medius, psoas, and iliacus were in general agreement with those reported at a similar running speed (3.5 m·s–1).7 As expected, the gluteal muscles produced peak forces during the loading response of stance, when hip extensor, abductor, and internal rotator joint moments are known to peak.25 However, despite extensor and abductor moments being comparable in magnitude, peak forces between the 3 gluteal muscles were quite different. The sum of peak forces from the gluteus medius and minimus, 2 primary hip abductors,20 was 3.5 times that of the gluteus maximus, a primary hip extensor. This disparity is not attributable to moment arm differences between the muscles, as the extension moment arm of the gluteus maximus is generally comparable to the abduction moment arm of the gluteus medius and minimus.20 The disparity is more likely due to the gluteus medius and minimus being better aligned to generate the required triaxial hip joint moments in running. This was particularly evident for the anterior fibers of the gluteus medius, which have a larger internal rotation moment arm than the more posterior fibers and were recruited to a greater extent in 770 | october 2014 | volume 44 | number 10 | journal of orthopaedic & sports physical therapy 44-10 Lenhart.indd 770 9/16/2014 4:47:03 PM 1 BFL 0 –2 –1 4 SM GMed 4 0 0.4 0 0.5 –2 AddBrev RF GMin 2 0 0 –0.4 –4 5 0 0 –0.5 –5 0.5 0.2 0 –1 AddLong TFL 1 Psoas –1 Normalized Muscle Power, W·kg –4 0 0.2 –1 0.2 Piriformis Sartorius 0 0 –0.2 0 20 40 60 80 100 Cycle, % 0 –0.2 –0.5 1 Iliacus Journal of Orthopaedic & Sports Physical Therapy® Downloaded from www.jospt.org at on November 2, 2014. For personal use only. No other uses without permission. Copyright © 2014 Journal of Orthopaedic & Sports Physical Therapy®. All rights reserved. 0 AddMag GMax 2 0 –0.2 0 20 40 60 80 100 0 20 Cycle, % 90% of preferred step rate 100% of preferred step rate 40 60 80 100 Cycle, % 110% of preferred step rate FIGURE 2. Mean hip muscle power (W·kg–1) across the running cycle. The shaded area indicates 1 SD of power produced across all participants at the preferred (100%) steprate condition. The other step rates (90% and 110% of preferred) had similar variance (not shown). The vertical dashed line indicates toe-off. Abbreviations: AddBrev, adductor brevis; AddLong, adductor longus; AddMag, adductor magnus; BFL, biceps femoris long head; GMax, gluteus maximus; GMed, gluteus medius; GMin, gluteus minimus; RF, rectus femoris; SM, semimembranosus; TFL, tensor fascia latae. the loading response (FIGURE 3). In addition to the gluteus maximus, the adductor magnus, hamstrings, and more posterior fibers of the gluteus medius and gluteus minimus also contributed to the hip extensor moment in stance. Similar observations were made by Dorn et al,7 who estimated that the gluteus maximus contributes about half of the hip extensor moment during the loading response of running at 3.5 m·s–1. Step rate had a marked effect on hip muscle forces and powers in stance. The gluteal muscle forces decreased in proportion to the increase in step rate. That is, a 10% increase in step rate resulted in approximately a 10% decrease in peak force from each of the gluteal muscles, with a corresponding reduction in negative and positive work. The gluteal muscles function to decrease forward speed of the body’s center of mass during early stance, and, in combination with the adductor magnus, provide nearly half of the peak vertical support of body weight.11 Because both the braking impulse and vertical displacement of the body’s center of mass are reduced when running at a higher step rate,13 the functional demands placed on the gluteal muscles (as well as adductor magnus) are likely reduced. Step rate had a substantial impact on piriformis muscle force and power. Simi- lar to the gluteal muscles, the piriformis reached peak force during the initial half of stance, with the muscle performing a period of negative work immediately preceding a period of positive work. Increasing step rate 10% above the preferred rate resulted in a 14% average reduction in peak piriformis force. Post hoc analysis of the negative work occurring only during initial stance revealed a nearly 40% reduction, indicating the eccentric load to the piriformis to be reduced by more than a third. However, there was a slight increase in negative work during early swing with an increase in step rate, which tempered the benefits of reduced negative work. Still, the overall negative work journal of orthopaedic & sports physical therapy | volume 44 | number 10 | october 2014 | 771 44-10 Lenhart.indd 771 9/16/2014 4:47:04 PM Journal of Orthopaedic & Sports Physical Therapy® Downloaded from www.jospt.org at on November 2, 2014. For personal use only. No other uses without permission. Copyright © 2014 Journal of Orthopaedic & Sports Physical Therapy®. All rights reserved. [ progressively decreased with an increase in step rate. With excessive stretch and load suggested as causative factors of running-related piriformis pain or syndrome,2,16,30 increasing running step rate may be a simple method of reducing the stretch and negative work performed by this muscle, thereby limiting injury risk and potentially being a mode of therapy. Future work should investigate this possibility. Several muscles required greater force production during early swing when step rate was higher, including the iliacus, rectus femoris, sartorius, tensor fascia latae, gluteus minimus, and adductor brevis. This finding is somewhat expected, as each of these muscles is considered a hip flexor either as a primary or secondary action,20 and each is suggested to have a key role in increasing running step rate.7 Predictably, most of these muscles performed positive work to advance the trail limb forward, while the rectus femoris and tensor fascia latae performed negative work owing to their biarticular attachments. With increased step rate, muscle forces were observed to increase during late swing, particularly those of the hamstrings and gluteals. This supports previous findings of increased EMG signal of these same muscles during late swing when step rate is increased.4 During this phase of the running stride, the hamstrings and gluteus maximus accelerate the hip into extension, while the hamstrings also work to oppose the knee from accelerating into extension.7 As such, the greater activity and force production from these muscles that occur with increased step rate are likely due to increased inertial loads, with muscles contributing to the more erect lower extremity posture that lessens hip and knee joint loads during stance.13,17 It should be noted that the peak force and negative work of the hamstrings when running at a higher step rate (110% of preferred) are less than 60% of those present during sprinting (7.8 m·s– 1 3 ), that is, well below the loads associated with hamstring strain injury.14 research report ] FIGURE 3. Geometric differences in gluteal muscle peak force (N·kg–1) production during loading response in the preferred (100%) step-rate condition. The muscle geometries were taken from a validated musculoskeletal model.1 The pattern of negative work preceding positive work for most of the muscles has implications for resistance training prescription. To reflect the energetics of these muscles during running, resistance exercise should involve a similar muscle contraction pattern. A rapid-repetition, stretch-shortening activity of eccentric contraction (negative work), followed immediately by concentric contraction (positive work), is recommended. This type of contraction pattern is clearly evident in several muscles at various times in the running cycle, including early stance (gluteals and piriformis), preswing/early swing (psoas, iliacus, and adductor longus and brevis), and late swing (hamstrings). Examples of exercises that may be well suited to reflect the energetics of these muscles during running include A skips (hip flexors),14 B skips (hip flexor and hamstrings),14 and split-squat jumps (gluteals).28 Although the intensity of these exercises can be scaled to the individual through speed of movement, injured runners may require less intense forms of exercise depending on symptom severity and provocation. Based on the increased swing-phase forces and powers produced by some muscles at a higher running step rate, these same exercises may be recommended as part of the initial gait-retraining process. In particular, resistance training of the hamstrings and several hip flexor muscles may be beneficial to facilitate the desired step rate, due to greater force requirements at specific phases of the running stride. Despite the increased forces for these muscles being relatively small (less than 1.5 N·kg–1), each muscle must develop these forces during each step; therefore, high-repetition resistance training may be most appropriate. Despite not being a defined objective of our study, we observed regional differences in force production within each gluteal muscle, exemplifying the complexity that exists in muscle recruitment under triaxial joint loading conditions (FIGURE 3). In the gluteus maximus, the middle fibers produced the greatest forces during loading response, whereas in the gluteus medius peak forces occurred in the anterior fibers. Peak forces in the gluteus minimus occurred in the posterior fibers. This regional variation in force requirements is likely due to the functional demands of the muscle. For example, during loading response, the gluteus medius primarily functions as a hip abductor to provide vertical support to the body, to which the anterior fibers have the greatest moment arm.20 Also of note, the anterior fibers of the gluteus medius produced the greatest force of any gluteal muscle, which may partially explain why musculotendon tears within the gluteus medius more commonly occur to the anterior fibers.5 Further, a regional variation in force production is consistent with experimentally obtained 772 | october 2014 | volume 44 | number 10 | journal of orthopaedic & sports physical therapy 44-10 Lenhart.indd 772 9/16/2014 4:47:04 PM Journal of Orthopaedic & Sports Physical Therapy® Downloaded from www.jospt.org at on November 2, 2014. For personal use only. No other uses without permission. Copyright © 2014 Journal of Orthopaedic & Sports Physical Therapy®. All rights reserved. EMG data of the gluteus minimus during walking, suggesting that the hipstabilizing role of the fibers may differ.26 Though we acknowledge that the model employed may not fully represent the underlying details that likely contribute to regional force variations within muscle, we nonetheless find it intriguing that our observations are consistent with EMG findings and common injury location. While characterizing individual muscle forces and powers during running provides useful insights into muscle function and potential injury risk factors, it is important for us to recognize the limitations of this work. We acknowledge that the findings were based on a generic musculoskeletal model that did not take into account any participant-specific information on muscle strengths or geometries. We also assumed a simple scalar relationship between muscle activation and force, which does not account for muscle forcelength and force-velocity effects. Muscle activations at any time step of the running simulations were estimated using numerical optimization. Specifically, a set of activations were found that generated the measured hip, knee, and ankle joint accelerations, while minimizing a sum of muscle-volume weighted squared activations.12 We previously compared the predicted muscle activation patterns to the EMG recordings of several major lower extremity muscles and found good agreement in bursts and phasing.17 It should be noted that EMG recordings of some muscles (eg, piriformis and adductor brevis) were not available for comparison. Our findings are based on running at preferred speed, ranging from 2.4 to 3.8 m·s–1, and therefore may not be generalizable to faster speeds. Despite temporal patterns of force production being similar, muscle force magnitude does not scale proportionally to speed.7 Some hip muscles were not included in the model (eg, obturator internus and externus) and others were simplified (eg, gemellus superior and inferior were simplified into a single musculotendon unit), which might have had greater influence on the distri- bution of muscle forces needed to equilibrate hip rotational moments. Finally, all participants were healthy, experienced runners. While it is pertinent to hypothesize about injury, it is unclear whether all of the results apply to injured populations. Future studies should explore muscle forces in those with injury, including patellofemoral pain, iliotibial band syndrome, and gluteal injuries. CONCLUSION O ur findings provide unique insights into the biomechanical demands placed on the individual hip muscles during running. Specifically, the peak force produced by the gluteus medius was substantially greater than that of any other hip muscle, including the gluteus maximus. Increasing running step rate led to an increase in hip flexor, hamstring, and hip extensor loading in swing, but, conversely, a substantial decrease in peak force and work during loading response in several primary hip muscles was observed. These results may enable clinicians to support and refine current treatment strategies, including exercise prescription and gait retraining, for running-related injuries. t KEY POINTS FINDINGS: During running, the greatest peak force was produced by the gluteus medius during stance phase and the iliacus during swing phase. In general, running with an increased step rate caused a reduction in peak forces of several muscles during stance and an increase during swing. IMPLICATIONS: These findings provide a more complete description of hip muscle demands during running, which is important for scientifically assessing how specific exercises and gait-retraining strategies may be most effective in injury prevention and recovery. CAUTION: Running mechanics are reflective of healthy individuals at preferred speed and may not be generalizable to injured populations. ACKNOWLEDGEMENTS: The authors would like to thank Christa Wille for her assistance with data collection, as well as the University of Wisconsin Medical Scientist Training Program and the University of Wisconsin Institute for Clinical and Translational Research. REFERENCES 1. A rnold EM, Ward SR, Lieber RL, Delp SL. A model of the lower limb for analysis of human movement. Ann Biomed Eng. 2010;38:269-279. http:// dx.doi.org/10.1007/s10439-009-9852-5 2. Boyajian-O’Neill LA, McClain RL, Coleman MK, Thomas PP. Diagnosis and management of piriformis syndrome: an osteopathic approach. J Am Osteopath Assoc. 2008;108:657-664. 3. Chumanov ES, Heiderscheit BC, Thelen DG. Hamstring musculotendon dynamics during stance and swing phases of high-speed running. Med Sci Sports Exerc. 2011;43:525-532. http:// dx.doi.org/10.1249/MSS.0b013e3181f23fe8 4. Chumanov ES, Wille CM, Michalski MP, Heiderscheit BC. Changes in muscle activation patterns when running step rate is increased. Gait Posture. 2012;36:231-235. http://dx.doi. org/10.1016/j.gaitpost.2012.02.023 5. Connell DA, Bass C, Sykes CA, Young D, Edwards E. Sonographic evaluation of gluteus medius and minimus tendinopathy. Eur Radiol. 2003;13:1339-1347. http://dx.doi.org/10.1007/ s00330-002-1740-4 6. Delp SL, Hess WE, Hungerford DS, Jones LC. Variation of rotation moment arms with hip flexion. J Biomech. 1999;32:493-501. 7. Dorn TW, Schache AG, Pandy MG. Muscular strategy shift in human running: dependence of running speed on hip and ankle muscle performance. J Exp Biol. 2012;215:1944-1956. http:// dx.doi.org/10.1242/jeb.064527 8. Ferber R, Davis IM, Williams DS, 3rd. Gender differences in lower extremity mechanics during running. Clin Biomech (Bristol, Avon). 2003;18:350-357. 9. Fredericson M, Cookingham CL, Chaudhari AM, Dowdell BC, Oestreicher N, Sahrmann SA. Hip abductor weakness in distance runners with iliotibial band syndrome. Clin J Sport Med. 2000;10:169-175. 10. Geraci MC, Jr., Brown W. Evidence-based treatment of hip and pelvic injuries in runners. Phys Med Rehabil Clin N Am. 2005;16:711-747. http:// dx.doi.org/10.1016/j.pmr.2005.02.004 11. Hamner SR, Seth A, Delp SL. Muscle contributions to propulsion and support during running. J Biomech. 2010;43:2709-2716. http://dx.doi. org/10.1016/j.jbiomech.2010.06.025 12. Happee R. Inverse dynamic optimization including muscular dynamics, a new simulation method applied to goal directed movements. J Biomech. 1994;27:953-960. http://dx.doi. org/10.1016/0021-9290(94)90267-4 journal of orthopaedic & sports physical therapy | volume 44 | number 10 | october 2014 | 773 44-10 Lenhart.indd 773 9/16/2014 4:47:04 PM Journal of Orthopaedic & Sports Physical Therapy® Downloaded from www.jospt.org at on November 2, 2014. For personal use only. No other uses without permission. Copyright © 2014 Journal of Orthopaedic & Sports Physical Therapy®. All rights reserved. [ 13. H eiderscheit BC, Chumanov ES, Michalski MP, Wille CM, Ryan MB. Effects of step rate manipulation on joint mechanics during running. Med Sci Sports Exerc. 2011;43:296-302. http://dx.doi. org/10.1249/MSS.0b013e3181ebedf4 14. Heiderscheit BC, Sherry MA, Silder A, Chumanov ES, Thelen DG. Hamstring strain injuries: recommendations for diagnosis, rehabilitation, and injury prevention. J Orthop Sports Phys Ther. 2010;40:67-81. http://dx.doi.org/10.2519/ jospt.2010.3047 15. Ireland ML, Willson JD, Ballantyne BT, Davis IM. Hip strength in females with and without patellofemoral pain. J Orthop Sports Phys Ther. 2003;33:671-676. http://dx.doi.org/10.2519/ jospt.2003.33.11.671 16. Kim JE, Kim KH. Piriformis syndrome after percutaneous endoscopic lumbar discectomy via the posterolateral approach. Eur Spine J. 2011;20:1663-1668. http://dx.doi.org/10.1007/ s00586-011-1764-z 17. Lenhart RL, Thelen DG, Wille CM, Chumanov ES, Heiderscheit BC. Increasing running step rate reduces patellofemoral joint forces. Med Sci Sports Exerc. 2014;46:557-564. http://dx.doi. org/10.1249/MSS.0b013e3182a78c3a 18. Lu TW, O’Connor JJ. Bone position estimation from skin marker co-ordinates using global optimisation with joint constraints. J Biomech. 1999;32:129-134. 19. Mascal CL, Landel R, Powers C. Management of patellofemoral pain targeting hip, pelvis, and trunk muscle function: 2 case reports. J Orthop Sports Phys Ther. 2003;33:647-660. http:// dx.doi.org/10.2519/jospt.2003.33.11.647 20. Neumann DA. Kinesiology of the hip: a focus research report 21. 22. 23. 24. 25. 26. 27. 28. on muscular actions. J Orthop Sports Phys Ther. 2010;40:82-94. http://dx.doi.org/10.2519/ jospt.2010.3025 Niemuth PE, Johnson RJ, Myers MJ, Thieman TJ. Hip muscle weakness and overuse injuries in recreational runners. Clin J Sport Med. 2005;15:14-21. Noehren B, Scholz J, Davis I. The effect of realtime gait retraining on hip kinematics, pain and function in subjects with patellofemoral pain syndrome. Br J Sports Med. 2011;45:691-696. http://dx.doi.org/10.1136/bjsm.2009.069112 Paluska SA. An overview of hip injuries in running. Sports Med. 2005;35:991-1014. http://dx.doi. org/10.2165/00007256-200535110-00005 Piazza SJ, Erdemir A, Okita N, Cavanagh PR. Assessment of the functional method of hip joint center location subject to reduced range of hip motion. J Biomech. 2004;37:349-356. http:// dx.doi.org/10.1016/S0021-9290(03)00288-4 Schache AG, Blanch PD, Dorn TW, Brown NA, Rosemond D, Pandy MG. Effect of running speed on lower limb joint kinetics. Med Sci Sports Exerc. 2011;43:1260-1271. http://dx.doi. org/10.1249/MSS.0b013e3182084929 Semciw AI, Green RA, Murley GS, Pizzari T. Gluteus minimus: an intramuscular EMG investigation of anterior and posterior segments during gait. Gait Posture. 2014;39:822-826. http:// dx.doi.org/10.1016/j.gaitpost.2013.11.008 Souza RB, Powers CM. Differences in hip kinematics, muscle strength, and muscle activation between subjects with and without patellofemoral pain. J Orthop Sports Phys Ther. 2009;39:1219. http://dx.doi.org/10.2519/jospt.2009.2885 Struminger AH, Lewek MD, Goto S, Hibberd E, ] 29. 30. 31. 32. 33. Blackburn JT. Comparison of gluteal and hamstring activation during five commonly used plyometric exercises. Clin Biomech (Bristol, Avon). 2013;28:783-789. http://dx.doi.org/10.1016/j. clinbiomech.2013.06.010 Taunton JE, Ryan MB, Clement DB, McKenzie DC, Lloyd-Smith DR, Zumbo BD. A retrospective case-control analysis of 2002 running injuries. Br J Sports Med. 2002;36:95-101. Tonley JC, Yun SM, Kochevar RJ, Dye JA, Farrokhi S, Powers CM. Treatment of an individual with piriformis syndrome focusing on hip muscle strengthening and movement reeducation: a case report. J Orthop Sports Phys Ther. 2010;40:103-111. http://dx.doi.org/10.2519/ jospt.2010.3108 van der Worp MP, van der Horst N, de Wijer A, Backx FJ, Nijhuis-van der Sanden MW. Iliotibial band syndrome in runners: a systematic review. Sports Med. 2012;42:969-992. http://dx.doi. org/10.2165/11635400-000000000-00000 van Gent RN, Siem D, van Middelkoop M, van Os AG, Bierma-Zeinstra SM, Koes BW. Incidence and determinants of lower extremity running injuries in long distance runners: a systematic review. Br J Sports Med. 2007;41:469-480; discussion 480. http://dx.doi.org/10.1136/bjsm.2006.033548 Woltring HJ. A Fortran package for generalized, cross-validatory spline smoothing and differentiation. Adv Eng Software. 1986;8:104-113. http:// dx.doi.org/10.1016/0141-1195(86)90098-7 @ MORE INFORMATION WWW.JOSPT.ORG GO GREEN By Opting Out of the Print Journal JOSPT subscribers and APTA members of the Orthopaedic and Sports Physical Therapy Sections can help the environment by “opting out” of receiving JOSPT in print each month as follows. If you are: • A JOSPT subscriber: Email your request to jospt@jospt.org or call the JOSPT office toll-free at 1-877-766-3450 and provide your name and subscriber number. • APTA Orthopaedic or Sports Section member: Go to http://www.apta.org/, log in, and select My Profile. Next click on Email Management/GoGreen. Toward the bottom of the list, you will find the Publications options and may opt out of receiving the print JOSPT. Please save this preference. Subscribers and members alike will continue to have access to JOSPT online and can retrieve current and archived issues anytime and anywhere you have Internet access. 774 | october 2014 | volume 44 | number 10 | journal of orthopaedic & sports physical therapy 44-10 Lenhart.indd 774 9/16/2014 4:47:05 PM ONLINE APPENDIX Peak Muscle Forces During Running at 90%, 100%, and 110% of Preferred Step Rate* TABLE 1 Significant P Value Muscle/Period 90% 100% 110% 90% Versus 100% 90% Versus 110% 100% Versus 110% Stance 3.65 1.03 3.83 0.98 4.07 0.97 … .0017 … Late swing 4.69 0.91 5.19 0.94 5.25 0.90 .0002 .0001 … Biceps femoris long head Semimembranosus Stance Late swing 7.95 2.22 8.38 2.04 8.95 2.08 … .0028 … 12.12 2.33 13.54 2.35 13.98 2.23 .0001 .0001 … 18.01 3.22 15.80 2.89 14.57 2.86 .0001 .0001 .0093 5.41 1.49 5.92 1.60 6.04 1.62 .0045 .0005 … 34.60 5.23 32.05 4.03 28.65 3.63 .0001 .0001 .0001 5.84 1.68 6.71 2.17 7.40 2.25 .0006 .0001 .0060 .0001 Journal of Orthopaedic & Sports Physical Therapy® Downloaded from www.jospt.org at on November 2, 2014. For personal use only. No other uses without permission. Copyright © 2014 Journal of Orthopaedic & Sports Physical Therapy®. All rights reserved. Gluteus maximus Stance Late swing Gluteus medius Stance Late swing Gluteus minimus 24.25 4.22 22.97 3.65 20.82 3.30 .0017 .0001 Early swing Stance 8.54 2.84 9.76 2.99 9.52 2.85 .0014 .0116 … Late swing 3.36 1.10 3.86 1.34 4.25 1.43 .0051 .0001 .0413 1.82 0.42 1.97 0.38 2.12 0.45 .0045 .0001 .0025 Tensor fascia latae Early swing Rectus femoris Stance 9.98 2.94 8.93 2.78 7.88 2.84 .0001 .0001 .0001 Early swing 7.28 1.59 8.00 1.43 9.11 1.79 .0002 .0001 .0001 0.38 0.09 0.41 0.08 0.46 0.10 .0088 .0001 .0011 12.78 3.63 13.19 2.94 13.36 3.17 … … … 17.63 3.96 19.29 3.53 20.43 4.16 .0004 .0001 Sartorius Early swing Psoas Early swing Iliacus Early swing .0164 Table continues on page A2. journal of orthopaedic & sports physical therapy | volume 44 | number 10 | october 2014 | A1 44-10 Lenhart.indd 1 9/19/2014 2:24:01 PM ONLINE APPENDIX Peak Muscle Forces During Running at 90%, 100%, and 110% of Preferred Step Rate* (continued) TABLE 1 Significant P Value Muscle/Period 90% 100% 110% 90% Versus 100% 90% Versus 110% 100% Versus 110% 3.01 0.97 2.69 0.89 2.61 0.97 .0072 .0008 … 3.36 0.86 3.62 0.75 3.76 0.76 .0054 .0001 … 1.57 0.41 1.59 0.36 1.63 0.37 … … … Adductor magnus Stance Adductor brevis Early swing Adductor longus Early swing Journal of Orthopaedic & Sports Physical Therapy® Downloaded from www.jospt.org at on November 2, 2014. For personal use only. No other uses without permission. Copyright © 2014 Journal of Orthopaedic & Sports Physical Therapy®. All rights reserved. Piriformis Stance 3.47 1.13 2.97 0.98 2.56 0.82 .0002 .0001 .0009 Early swing 1.27 0.42 1.53 0.39 1.78 0.37 .0001 .0001 .0001 Late swing 1.20 0.61 1.29 0.57 1.34 0.49 … … … 0.69 0.16 0.75 0.14 0.78 0.15 .0004 .0001 … Stance 0.85 0.25 0.88 0.22 0.94 0.23 … .0103 … Late swing 1.34 0.26 1.49 0.26 1.53 0.24 .0001 .0001 … Pectineus Early swing Semitendinosus Gracilis Early swing 0.43 0.11 0.45 0.12 0.44 0.12 … … … Late swing 0.28 0.07 0.30 0.07 0.30 0.06 … .0448 … Quadratus femoris Stance 1.46 0.96 1.17 0.79 1.06 0.69 .0143 .0005 … Late swing 2.37 0.78 2.34 0.84 2.20 0.69 … … … Gemelli Stance 1.81 0.98 1.44 0.80 1.16 0.67 .0012 .0001 .0160 Early swing 2.12 0.56 2.31 0.53 2.65 0.60 .0133 .0001 .0001 *Values are mean SD N·kg–1 unless otherwise indicated. For muscles with multiple peaks, the range queried for each peak is listed based on the period of the running cycle. A2 | october 2014 | volume 44 | number 10 | journal of orthopaedic & sports physical therapy 44-10 Lenhart.indd 2 9/19/2014 2:24:01 PM ONLINE APPENDIX TABLE 2 Positive and Negative Work Performed by Each Muscle Across the Running Cycle at 3 Different Step-Rate Conditions (90%, 100%, and 110% of Preferred)* Significant PP Value Value Significant Muscle/Work 90% 100% 110% 90% Versus 100% 90% Versus 110% 100% Versus 110% Biceps femoris long head Positive 0.044 0.017 0.045 0.015 0.045 0.015 … … … Negative –0.055 0.014 –0.056 0.015 –0.060 0.017 … .0008 .0029 Journal of Orthopaedic & Sports Physical Therapy® Downloaded from www.jospt.org at on November 2, 2014. For personal use only. No other uses without permission. Copyright © 2014 Journal of Orthopaedic & Sports Physical Therapy®. All rights reserved. Semimembranosus Positive 0.110 0.038 0.100 0.034 0.100 0.034 … … … Negative –0.170 0.041 –0.180 0.042 –0.200 0.048 .0478 .0001 .0003 0.170 0.058 0.150 0.048 .0003 .0001 … –0.033 0.036 –0.022 0.021 .0001 .0001 .0179 Gluteus maximus Positive Negative 0.210 0.066) –0.051 0.030 Gluteus medius Positive Negative 0.260 0.063 –0.110 0.038 0.210 0.048 0.170 0.042 .0001 .0001 .0001 –0.100 0.033 –0.073 0.030 .0449 .0001 .0001 Gluteus minimus Positive 0.150 0.049 0.130 0.044 0.100 0.038 .0001 .0001 .0001 Negative –0.099 0.033 –0.099 0.029 –0.080 0.025 … .0001 .0001 Tensor fascia latae Positive 0.013 0.005 0.013 0.005 0.012 0.005 … … … Negative –0.032 0.010 –0.032 0.010 –0.030 0.001 … .0061 .0085 Rectus femoris Positive 0.080 0.029 0.074 0.025 0.067 0.023 .0215 .0001 .0293 Negative –0.370 0.093 –0.350 0.088 –0.340 0.082 .0007 .0001 … Sartorius Positive 0.015 0.004 0.015 0.003 0.016 0.003 … … … Negative –0.005 0.002 –0.004 0.002 –0.003 0.001 … .0001 .0049 Psoas Positive 0.099 0.031 0.100 0.024 0.100 0.022 … … … Negative –0.043 0.019 –0.039 0.015 –0.035 0.016 … .0026 … Iliacus Positive 0.150 0.033 0.170 0.035 0.190 0.037 .0003 .0001 .0001 Negative –0.089 0.030 –0.079 0.030 –0.075 0.030 .0071 .0002 … Table continues on page A4. journal of orthopaedic & sports physical therapy | volume 44 | number 10 | october 2014 | A3 44-10 Lenhart.indd 3 9/19/2014 2:24:01 PM ONLINE APPENDIX TABLE 2 Positive and Negative Work Performed by Each Muscle Across the Running Cycle at 3 Different Step-Rate Conditions (90%, 100%, and 110% of Preferred)* (continued) Significant PP Value Value Significant Muscle/Work 90% 100% 110% 90% Versus 100% 90% Versus 110% 100% Versus 110% Adductor magnus Positive 0.033 0.014 0.030 0.014 0.027 0.014 .0126 .0001 … Negative –0.007 0.005 –0.006 0.004 –0.004 0.003 … .0003 .0044 Adductor brevis Positive Journal of Orthopaedic & Sports Physical Therapy® Downloaded from www.jospt.org at on November 2, 2014. For personal use only. No other uses without permission. Copyright © 2014 Journal of Orthopaedic & Sports Physical Therapy®. All rights reserved. Negative 0.035 0.014 0.038 0.014 0.037 0.013 … … … –0.021 0.011 –0.019 0.009 –0.015 0.007 … .0001 .0071 Adductor longus Positive 0.026 0.009 0.028 0.010 0.027 0.009 Negative –0.015 0.006 –0.013 0.005 –0.011 0.004 … … … .0037 .0001 .0017 Piriformis Positive 0.017 0.010 0.013 0.008 0.011 0.006 .0006 .0001 .0200 Negative –0.013 0.006 –0.011 0.005 –0.010 0.004 .0382 .0002 … Pectineus Positive 0.007 0.002 0.007 0.002 0.007 0.002 .0025 .0004 … Negative –0.003 0.002 –0.003 0.001 –0.002 0.001 .0270 .0001 .0496 Semitendinosus Positive 0.014 0.005 0.013 0.004 0.013 0.004 … … … Negative –0.023 0.005 –0.024 0.006 –0.026 0.006 … .0001 .0005 Gracilis Positive 0.012 0.006 0.011 0.006 0.009 0.005 .0037 .0001 .0002 Negative –0.007 0.002 –0.006 0.002 –0.006 0.002 … .0070 … 0.007 0.004 .0059 .0008 … … .0003 .0220 Quadratus femoris Positive Negative 0.009 0.007 –0.028 0.012 0.007 0.005 –0.026 0.011 –0.022 0.010 Gemelli Positive 0.011 0.006 0.009 0.004 0.008 0.003 .0417 .0002 … Negative –0.015 0.008 –0.013 0.006 –0.012 0.006 .0085 .0002 … *Values are mean SD J·kg–1 unless otherwise indicated. A4 | october 2014 | volume 44 | number 10 | journal of orthopaedic & sports physical therapy 44-10 Lenhart.indd 4 9/19/2014 2:24:01 PM
