read this document for directions
Term Project – super normal growth
After you have analyzed the data as I suggest in detail elsewhere, you will come up with your estimate of the growth rate in dividends for your company (call that step 1). In step 2, you will pay attention to the information I gave you when we covered chapter 8 (chapter 9 in the 5 th edition) as inputs for the SML and use those inputs correctly to get a required rate of return for investors in the company’s stock
(which you will use as the discount rate for future dividends), call this K s
. Step 3 is to find the present value of the infinite stream of future dividends (this PV is the intrinsic value of the company – the value based on your assessment of the fundamentals). If your growth rate is within 1 percentage point of K s or greater than K s
, then you cannot use the constant growth model to value the stock and you have to use the super normal growth model (also called two state growth model). Go back and review that in chapter 7 (chapter 8 in the 5 th edition) if you do not remember exactly what is involved. I assume in the remaining discussion that you know how to use that model.
You will have to determine how many years your company will grow at the high rate of growth you determined in step 1. Use your head to think about it, talk to your teammates. Make an assessment.
Do not just use a small number like we did in classroom problems. Those small numbers were made up so that you wouldn’t have to do very many calculations by hand, not because that is always the way it is.
If your growth rate is extremely large, you might go a shorter period than if it is very close to K s
, but the main factors determining the number of years have to do with your company and its industry – How long can it sustain that kind of growth (call this number of years N)?
After determining N, take D
0
(the most recent ANNUAL dividend) and forecast out dividends through D
N
.
At this point you need P
N
to include in period N cash flow. Recall that P
N
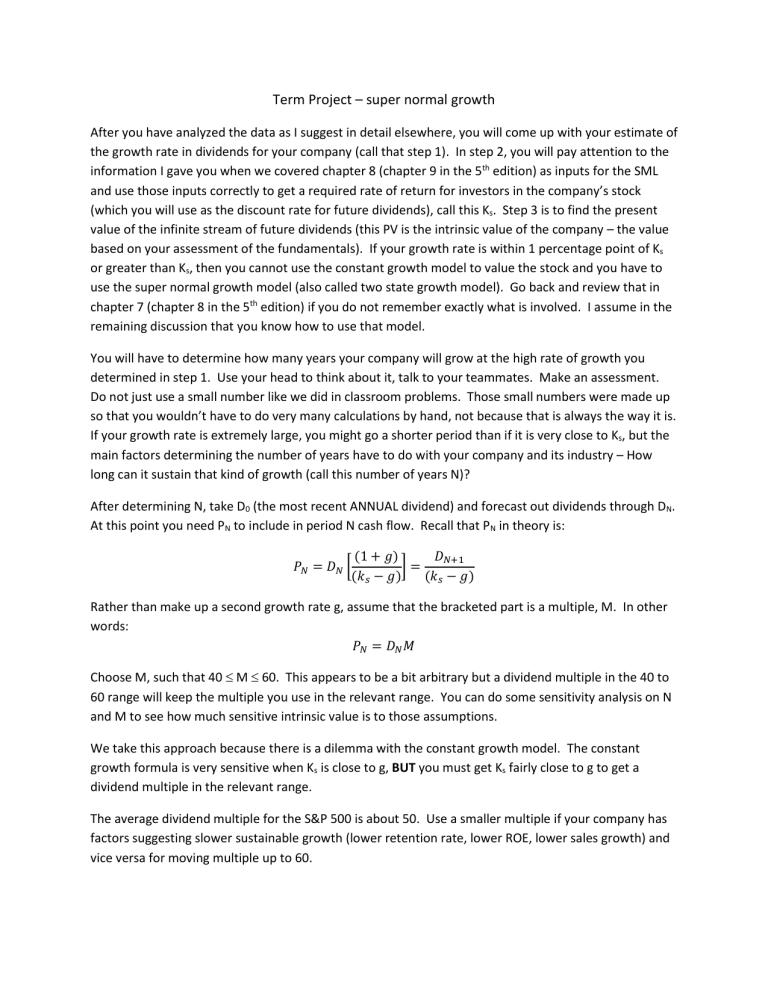
in theory is:
𝑃
𝑁
= 𝐷
𝑁
(1 + 𝑔)
[
(𝑘 𝑠
− 𝑔)
] =
(𝑘
𝐷
𝑁+1 𝑠
− 𝑔)
Rather than make up a second growth rate g, assume that the bracketed part is a multiple, M. In other words:
𝑃
𝑁
= 𝐷
𝑁
𝑀
Choose M, such that 40
M
60. This appears to be a bit arbitrary but a dividend multiple in the 40 to
60 range will keep the multiple you use in the relevant range. You can do some sensitivity analysis on N and M to see how much sensitive intrinsic value is to those assumptions.
We take this approach because there is a dilemma with the constant growth model. The constant growth formula is very sensitive when K s
is close to g, BUT you must get K s
fairly close to g to get a dividend multiple in the relevant range.
The average dividend multiple for the S&P 500 is about 50. Use a smaller multiple if your company has factors suggesting slower sustainable growth (lower retention rate, lower ROE, lower sales growth) and vice versa for moving multiple up to 60.
Some teams follow these instructions and then tell me that the resulting P
N is the value of the company.
This is not complete. After you have P
N
continue on and use the two stage growth model. P
N
is supposed to be added to period N cash flow and the present value taken.

