learn
advertisement
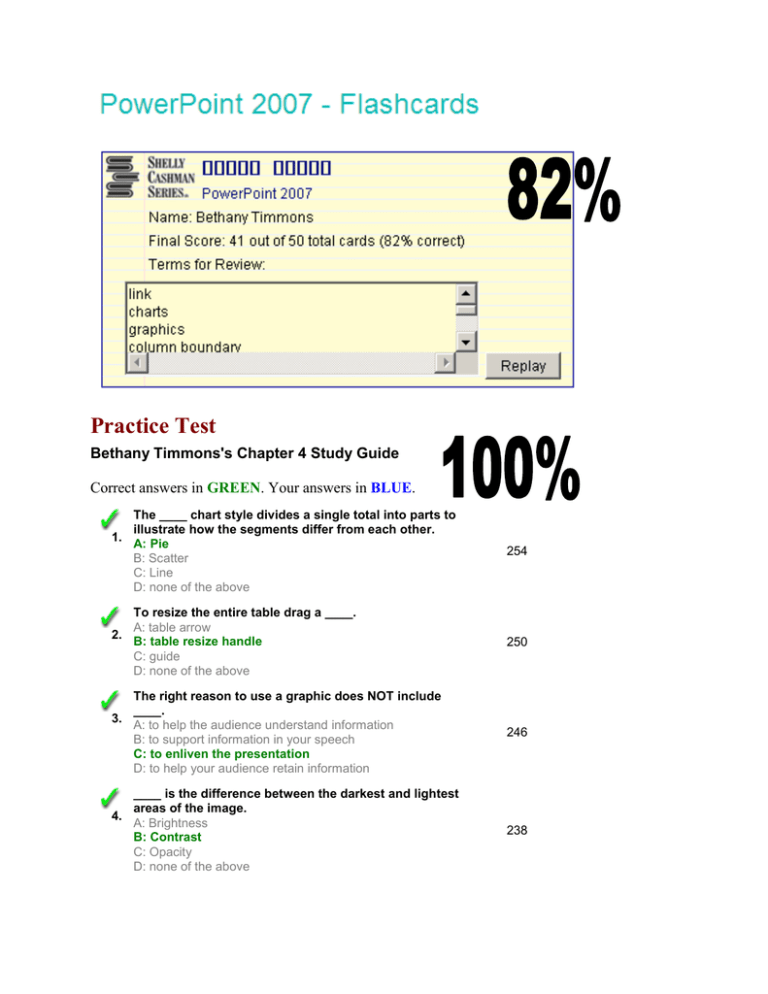
Practice Test Bethany Timmons's Chapter 4 Study Guide Correct answers in GREEN. Your answers in BLUE. The ____ chart style divides a single total into parts to illustrate how the segments differ from each other. 1. A: Pie B: Scatter C: Line D: none of the above 254 To resize the entire table drag a ____. A: table arrow 2. B: table resize handle C: guide D: none of the above 250 The right reason to use a graphic does NOT include ____. 3. A: to help the audience understand information B: to support information in your speech C: to enliven the presentation D: to help your audience retain information 246 ____ is the difference between the darkest and lightest areas of the image. 4. A: Brightness B: Contrast C: Opacity D: none of the above 238 Accent colors are often used as ____. A: fill colors on graphs 5. B: shadows C: both a. and b. D: neither a. nor b. 231 Graphical elements such as clips and photographs are considered to be in the ____ category. 6. A: images B: information graphics C: both a. and b. D: neither a. nor b. 226 If you did not conduct the research yourself, you should give credit to ____. 7. A: the library where the information was found B: the source of the information (i.e. publication name, author) C: the person who helped you find the information D: all of the above 257 The ____ chart style displays the effect on one variable when another variable changes. 8. A: Pie B: Scatter C: Line D: none of the above 254 A bevel is an example of ____ that you can add to a table. 9. A: a color scheme B: a font C: an effect D: a graphic 252 A grid consisting of rows and tables is a ____. A: chart 10. B: table C: graph D: none of the above 246 Adding a ____ to a clip helps add visual interest. A: style 11. B: utensil C: perspective D: none of the above 240 Researchers have determined that black or dark blue on a ____ screen is an extremely effective color 12. combination. A: light blue B: white C: gray D: none of the above 231 Graphical elements such as charts, graphs and diagrams are considered to be in the ____ category. 226 13. A: images B: information graphics C: both a. and b. D: neither a. nor b. The weight of a border is measured in ____ which is the unit of measure used by the graphic arts industry. 14. A: inches B: points C: pixels D: none of the above 262 The chapter recommended several tips that did NOT include ____. 15. A: to use legends prominently to keep the chart clean B: to use two-dimensional charts over three-dimensional charts C: to use three-dimensional charts because the added design elements aid in comprehension D: to use bar and pie charts with general adult audiences 254 A ____ gives the appearance that a light is displayed on the table with a shadow behind the graphic. 16. A: reflection B: shadow C: either a. or b. D: neither a. nor. b 252 The intersection of rows and columns are called ____. A: cells 17. B: active boxes C: titles D: data 246 The chapter recommended making the hyperlinks ____ as a visual cue to the presenter. 18. A: as large as possible B: as small as possible C: either a. or b. D: neither a. nor b. 243 Complex messages and formal settings call for ____ fonts. 19. A: simple B: complex C: colorful D: none of the above 233 A ____ is a connection from one slide to a Web page, another slide or a file. 20. A: hyperlink B: tab C: snap D: none of the above 230


