Evaluating policy, system, and environmental change initiatives for
advertisement
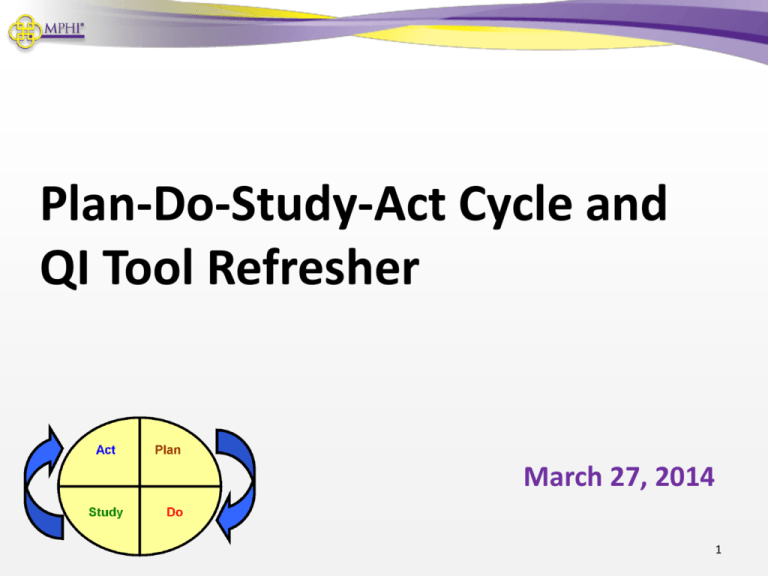
Plan-Do-Study-Act Cycle and QI Tool Refresher March 27, 2014 1 WELCOME BACK! 2 Today’s Agenda • PDSA Refresher – Quality Improvement Fundamentals – Plan-Do-Study-Act Cycle • Quality Improvement Application • Wrap-up – Questions and Training Post-assessment 3 QI Fundamentals • • • • • Definition Quality Assurance vs. Quality Improvement Benefits Four Basic Principles 3 Key Questions 4 QI in Our Terms “QI is the use of a deliberate and defined improvement process, such as Plan-Do-Study-Act, which is focused on activities that are responsive to community needs and improving population health. It refers to a continuous and ongoing effort to achieve measurable improvements in the efficiency, effectiveness, performance, accountability, outcomes, and other indicators of quality in services or processes which achieve equity and improve the health of the community.” Bialek, R., Beitsch, L. M., Cofsky, A., Corso, L., Moran, J., Riley, W., & Russo, P. (2009). Proceedings from Accreditation Coalition Workgroup: Quality Improvement in Public Health. 5 QA and QI are Not the Same Quality Assurance Quality Improvement Guarantees quality Raises quality Relies on inspection Emphasizes prevention Uses a reactive approach Uses a proactive approach Looks at compliance with standards Improves the processes to meet standards Requires a specific fix Requires continuous efforts Relies on individuals Relies on teamwork Examines criteria or requirements Asks, “Do we provide good services?” Examines processes or outcomes Asks, “How can we provide better services?” 6 QI Can… • Reduce cost and redundancy • Eliminate waste • Streamline processes • Enhance ability to meet service demand • Increase customer satisfaction • Improve outcomes! 7 QI - Four Basic Principles • Develop a strong customer (client) focus • Continually improve all processes • Involve employees • Mobilize both data and team knowledge to improve decision-making 8 QI – Three Key Questions 1. What are we trying to accomplish? 2. How will we know that a change is an improvement? 3. What changes can we make that will result in improvement? 9 Where do we begin? The Plan-Do-Study-Act (PDSA) Cycle • PDSA (also known as Plan-Do-Check-Act (PDCA), was made popular by Dr. W. Edwards Deming • Is widely used by quality professionals, process improvement engineers, & health care professionals • Science based, data driven, iterative process improvement methodology • Turns ideas into action and connects that action to learning 10 PDSA – An Overview • • • • Four Stages Nine Steps Repeatable Steps Can be used by one person, a team, or an agency • Used to improve existing processes 11 Stage One - PLAN Step 1 • Getting Started Step 2 • Assemble the Team Step 3 • Examine the Current Approach Step 4 • Identify Potential Solutions Step 5 • Develop an Improvement Theory 12 Stage Two - DO •Test the Step 6 Theory 13 Stage Three - STUDY •Study the Step 7 Results 14 Stage Four - ACT Step 8 • Standardize the Improvement or Develop a New Theory Step 9 • Establish Future Plans 15 QI Toolbox for the PLAN Stage • Team Charter - A Tool to Keep You Organized • Aim Statement - A Tool to Define the Goal • Process Mapping - A Tool to Examine Current Process Flow • Fishbone Diagram - A Tool for Identifying Root Causes • Affinity Diagram - A Tool to Identify Potential Solutions 16 A Tool to Keep you Organized: Team Charter 17 QI Team Charter What is it? One to two page document that describes the team’s purpose and targeted improvement. • Serves as your team’s roadmap • Helps reduce the “now what?” feeling • Helps the team come to agreement regarding: • Communication • Accountability • Delivery of products • Evolves over the course of the project 18 What to Include: • • • • • • • • • • Team sponsor Team members and roles Problem, issue, or opportunity statement Description of the process improvement Aim statement Customers and their needs Timeline for completing each stage of the PDSA cycle Timeline and frequency of team meetings Internal and external stakeholders Improvement theories (If…Then) 19 A Tool to Define the Goal: Aim Statement A concise, specific, written statement that defines precisely what the team hopes to accomplish with its QI efforts. Remember the three fundamental questions when writing your aim: 1. What are we trying to accomplish? 2. How will we know that a change is an improvement? 3. What changes can we make that will result in improvement? 20 Aim Statements • Include a numerical measure for the target • Are time specific and measurable • Define the specific population that will be affected 21 A Tool to Examine Process Flow: Process Mapping • Analyze and improve processes – Identify areas of complexity and re-work – Generate ideas for improvement – Illustrate process improvements 22 Preparing to Process Map 1. 2. 3. 4. 5. 6. 7. • Assemble your QI team • Determine which process needs to be documented • Agree on where the process begins and ends • Agree on the level of detail that will be displayed • Create a list of the steps taken in the current process • Construct your process map by ordering the steps • Identify additional staff to review or provide input on your process map 23 Symbols used to Process Map • Start & End: An oval is used to show the materials, information or action (inputs) to start the process or to show the results at the end (output) of the process. • Activity: A box or rectangle is used to show a task or activity performed in the process. Although multiple arrows may come into each box, usually only one arrow leaves each box. • Decision: A diamond shows those points in the process where a yes/no question is being asked or a decision is required. • Flow: An arrow shows the direction or flow of a process. 24 25 A Few Hints and Tips • Map the current process! • It’s okay if team members have different ideas about how the process works. • Keep steps simple; begin each step with an action verb. • Process mapping is dynamic! • Post-it notes, dry-erase markers, & pencils are your friend! 26 A Tool for Root Cause Analysis: Fishbone Diagrams 27 Fishbone Diagrams - Purpose • To identify and examine underlying or root causes of a problem • To identify a target for your improvement that is likely to lead to change • To explore possible causes of a problem 28 Fishbone Diagrams: Construction Step 1 Step 2 Step 3 Step 4 • Write the Problem/Effect in a box on the far right side of your paper, dry erase board, etc. • Draw an arrow (backbone) leading to that box • Draw smaller arrows (bones) leading to the backbone, and label these arrows with your major causes • For each cause, brainstorm minor causes related to each major cause and note them on the diagram by placing lines on each of the major bones. 29 A Tool to Identify Potential Solutions: Affinity Diagrams Group 1 Group 2 Group 3 Group 4 Idea Idea Idea Idea Idea Idea Idea Idea Idea Idea Idea Idea Idea Idea Idea Idea 30 Affinity Diagram: Purpose • Creatively generate a large number of ideas and organize them into natural groupings among them to understand possible solutions to a problem. 31 Affinity Diagrams: When to Use • To generate consensus • When you need your team to think creatively • To breakdown communication barriers • To allow breakthroughs to emerge naturally • To overcome “team paralysis” 32 Affinity Diagrams: Step by Step Step 1 Step 2 Step 3 Step 4 • Phrase the issue under discussion as a full sentence • Brainstorm at least 20 ideas or issues • A “typical” Affinity has 40-60 items, but 100 or more are not unusual • Simultaneously and quickly sort ideas into 5 to 10 related groupings • For each grouping, create summary or header cards using consensus • Strive to capture the essence of all the ideas in each grouping 33 Questions? 34 Break 35 PDSA Application 36 Lunch 37 PDSA Application, con’t 38 Next Steps 39 Questions? 40 Evaluation and Adjourn Thank you! 41
