Four Quadrant Diagram
advertisement
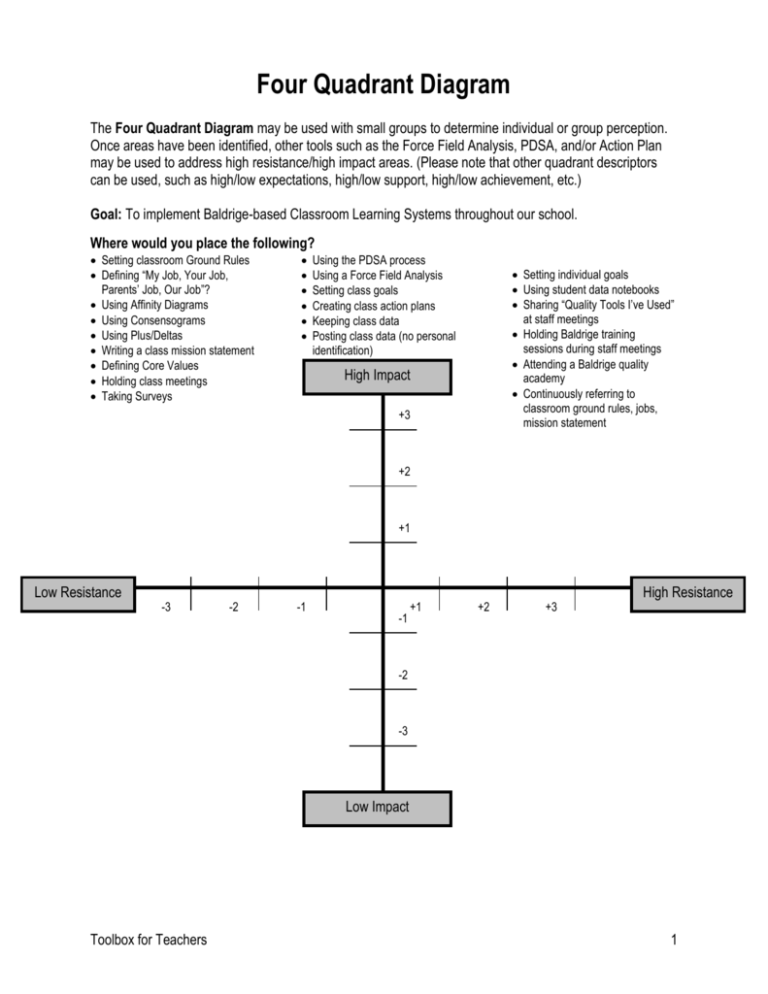
Four Quadrant Diagram The Four Quadrant Diagram may be used with small groups to determine individual or group perception. Once areas have been identified, other tools such as the Force Field Analysis, PDSA, and/or Action Plan may be used to address high resistance/high impact areas. (Please note that other quadrant descriptors can be used, such as high/low expectations, high/low support, high/low achievement, etc.) Goal: To implement Baldrige-based Classroom Learning Systems throughout our school. Where would you place the following? Setting classroom Ground Rules Defining “My Job, Your Job, Parents’ Job, Our Job”? Using Affinity Diagrams Using Consensograms Using Plus/Deltas Writing a class mission statement Defining Core Values Holding class meetings Taking Surveys Using the PDSA process Using a Force Field Analysis Setting class goals Creating class action plans Keeping class data Posting class data (no personal identification) Setting individual goals Using student data notebooks Sharing “Quality Tools I’ve Used” at staff meetings Holding Baldrige training sessions during staff meetings Attending a Baldrige quality academy Continuously referring to classroom ground rules, jobs, mission statement High Impact +3 +2 +1 Low Resistance -3 -2 -1 -1 +1 +2 +3 High Resistance -2 -3 Low Impact Toolbox for Teachers 1 Four Quadrant Diagram High Impact +4 +3 +2 +1 Low Resistance High Resistance -4 -3 -2 -1 +1 +2 +3 +4 -1 -2 -3 -4 Low Impact Toolbox for Teachers 2
